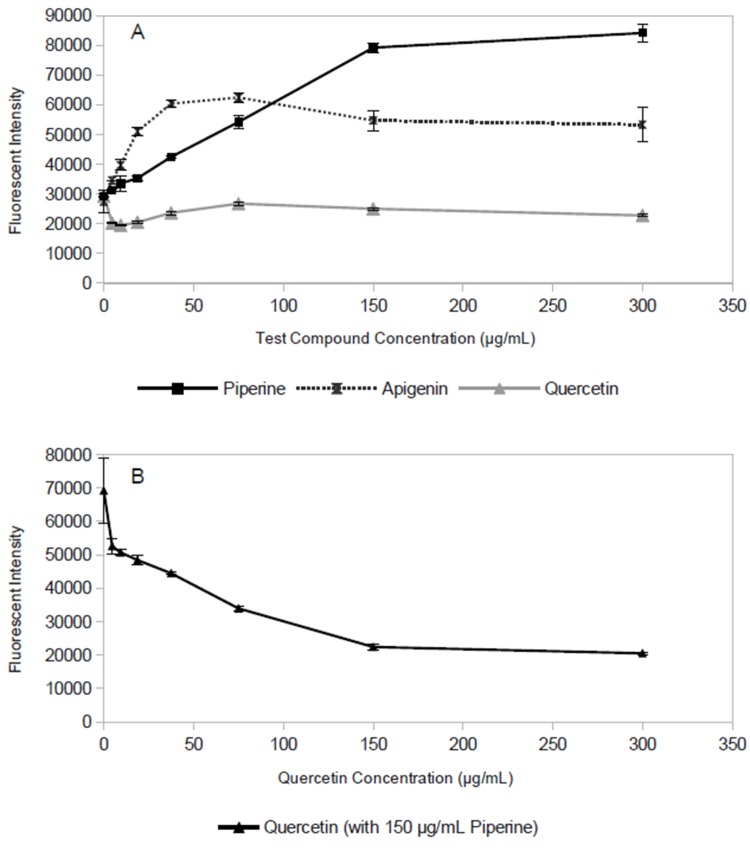
Fig 2. Change in fluorescence due to ethidium accumulation by S. aureus in the presence of putative inhibitors.
(A) Dose-response curves for the flavonoids apigenin and quercetin. (B) Fluorescence observed for 150 μg/mL piperine in the presence of increasing concentrations of quercetin. Decrease in fluorescence with increasing quercetin concentration in (B) can be attributed to fluorescence quenching by the flavonoid. Data points represent the mean of triplicate measurements (biological replicates), error bars represent standard deviation.

