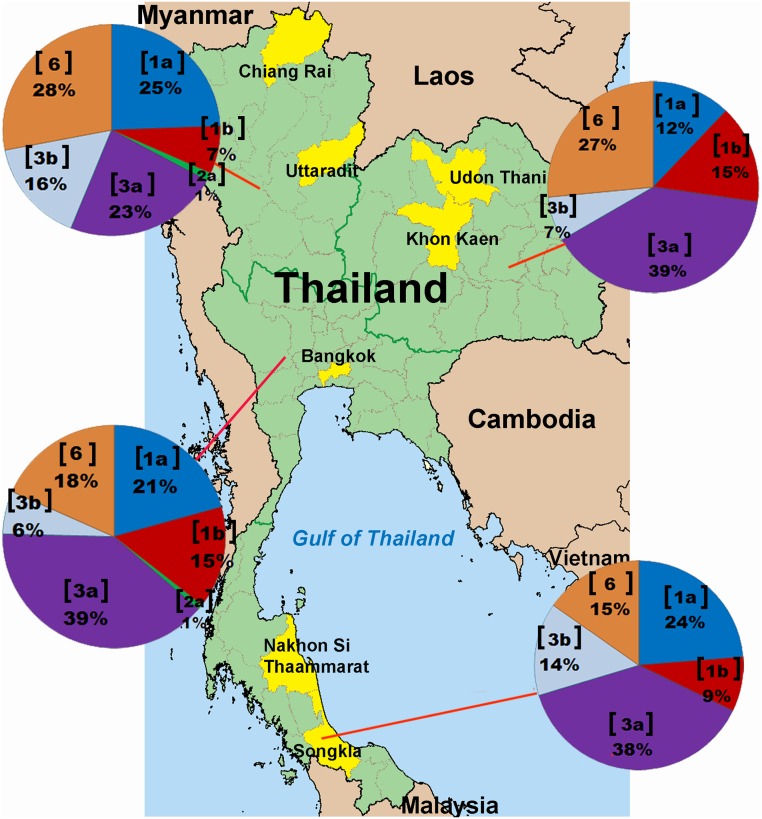
Fig 1. Distribution of HCV genotypes and subtypes in the 4 regions of Thailand.
Pie charts indicate the genotypic distribution in the North, Northeast, Central and South based on the analysis of 588 samples. The genotype or subtype is indicated in a bracket, accompanied by the proportion in percentage.

