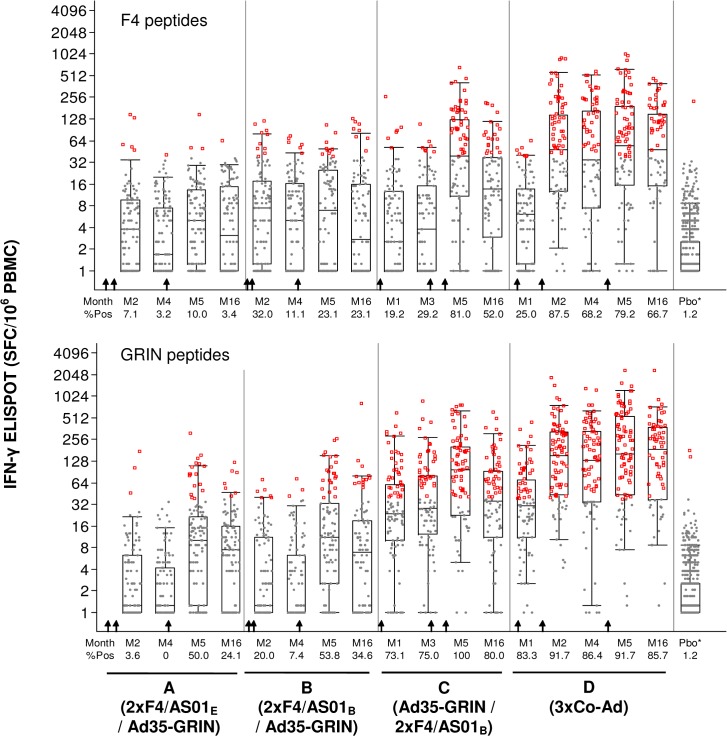
Fig 4. IFN-γ ELISPOT Response Magnitude to Any F4 and GRIN Antigens by Time Post Vaccination and Dose Groups.
The y-axis shows the SFC/106 PBMC on a half-log scale and the x-axis shows the time points post vaccination in months (M). A. F4 (any of p24+RT+Nef+p17 peptide pools) and B. GRIN (any of Gag+RT+Int+Nef peptides pools). Gray dots: response below the cut-off to any of the 8 peptide pools; red circles: response above the cut-off to any of the 8 peptide pools. For the vaccine groups, the overlaid box plot summarizes the overall responses (i.e., the median, 1st and 3rd quartiles and Percentile 95th). All baseline and placebo (Pbo*) groups are combined in the far right box plot. The arrows indicate when the vaccines were given for each group (lower X-axis).

