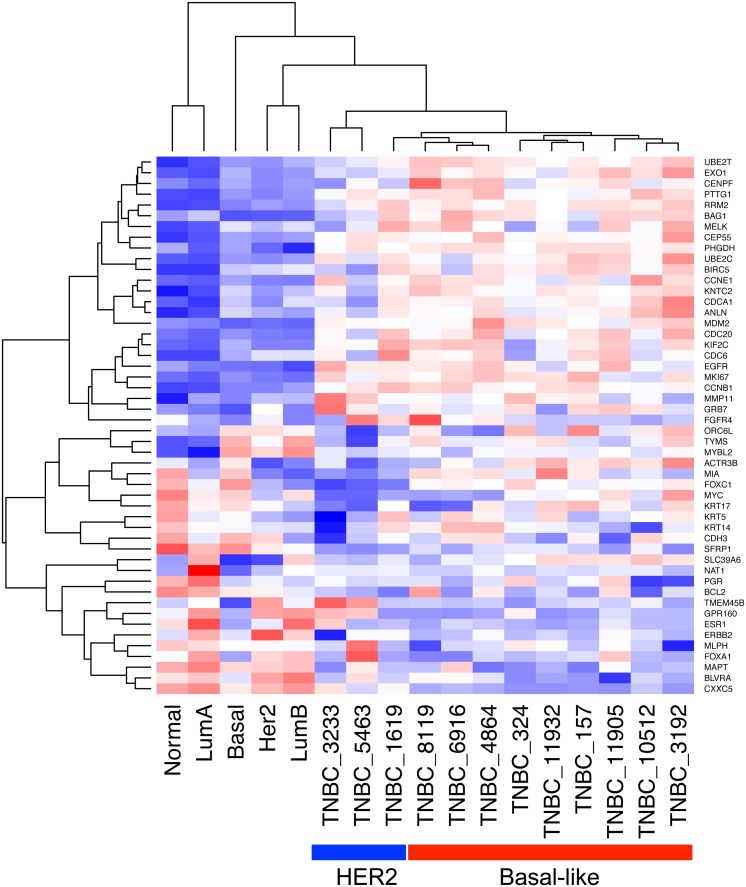
Fig 1. PAM50 classification of TNBC samples.
The hierarchically-clustered normalized expression values of the PAM50 classifier genes is shown for the 12 triple negative breast cancers (TNBCs) analyzed and the five centroids. The samples were classified according to their correlation with the PAM50 centroids. Red and blue boxes represent overexpressed and down-regulated genes, respectively.

