Figure 2.
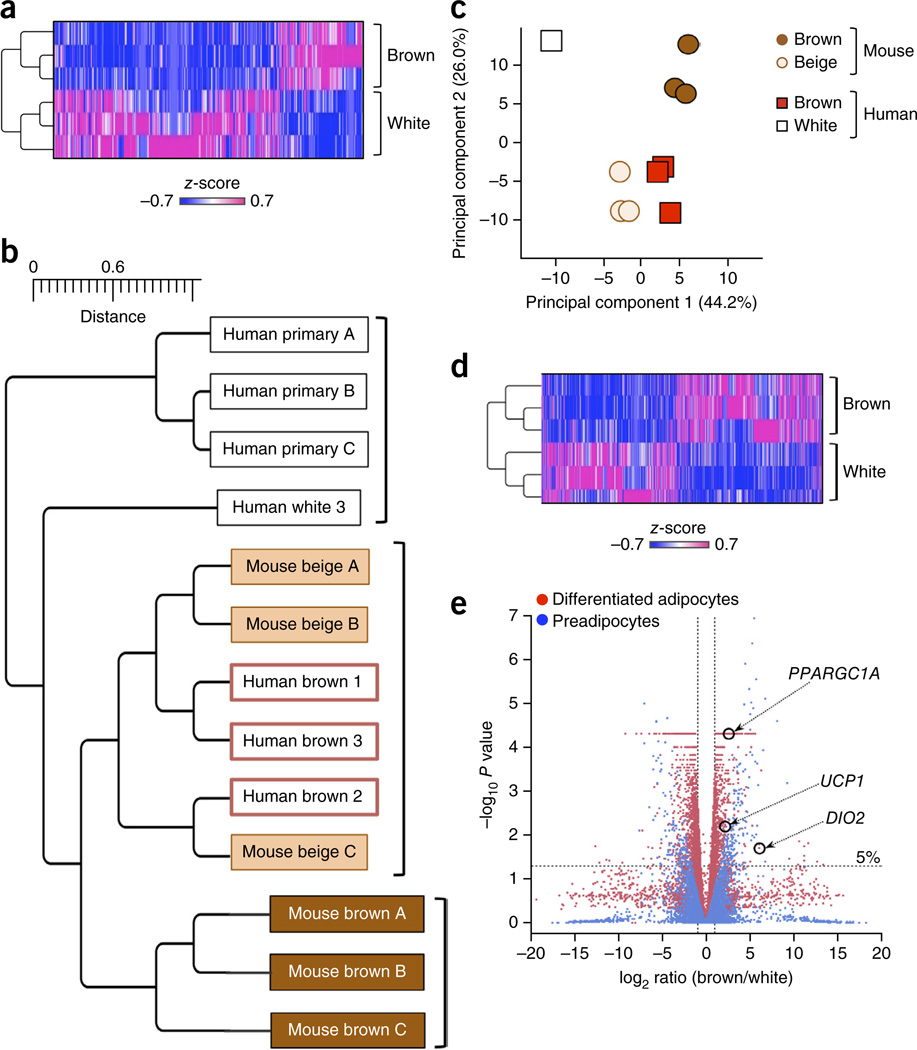
Genome-wide gene expression analyses indicate a close relationship between human brown adipocytes and mouse beige adipocytes. (a) Expression profile and hierarchical clustering of the differentially expressed genes between differentiated clonal human brown adipocyte cultures 1–3 and differentiated clonal white adipocyte cultures 1–3 by two-fold or more. n = 3 for each cell type. The color scale shows z-scored FPKM (fragments per kilobase of exon per million fragments mapped) representing the mRNA level of each gene in a blue (low expression)-white-red (high expression) scheme. (b) Hierarchical clustering of human and mouse adipocytes as visualized by TreeGraph. The horizontal distance represents similarities among each cluster. (c) Principal component (PC) analysis of the transcriptome from human and mouse differentiated adipocytes. PC analysis was done using the same gene expression data set used in b, that is, the RNA-seq data set obtained from differentiated clonal human brown and white adipocyte cultures, and the microarray data set (GSE39562) from differentiated clonal mouse classical brown and beige adipocytes. Numbers in parentheses represent the proportion of data variance explained by each PC. (d) Expression profiles and hierarchical clustering of the differentially expressed genes between undifferentiated clonal human brown preadipocyte cell lines 1–3 and white preadipocyte cell lines 1–3 by two-fold or more. n = 3 for each cell type. The color scale is the same as in a. (e) Volcano plot of transcriptomes in the clonal differentiated human brown and white adipocyte cultures (red) and in the clonal undifferentiated human brown and white preadipocyte lines (blue). n = 3 for each cell type. The log-fold change between brown versus white is shown on the x-axis. The y-axis represents the −log10of the P values by delta method–based test. Previously defined BAT-enriched markers are shown.

