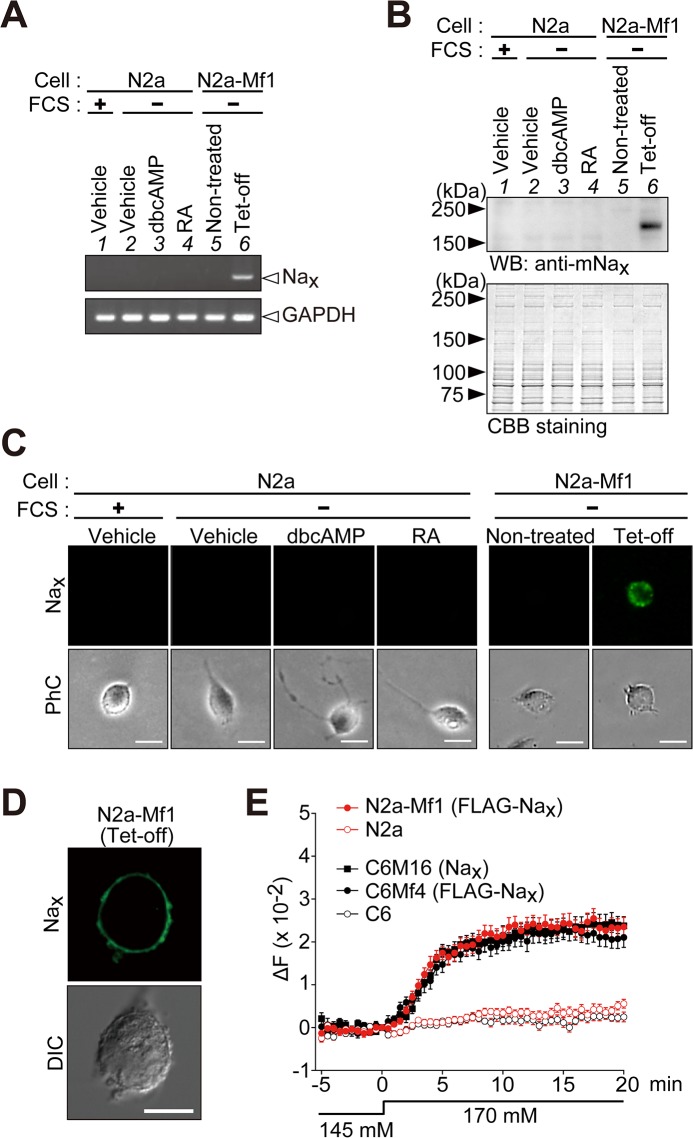
Fig 2. Establishment of mouse neuroblastoma Neuro-2a cells that inducibly express Nax.
(A) A RT-PCR analysis of the expression of Nax (upper) and glyceraldehyde 3-phosphate dehydrogenase (GAPDH, lower). Lane 1, parental Neuro-2a (N2a) cells cultured in DMEM containing 10% FCS; lanes 2–4, Neuro-2a cells cultured in serum-free medium with vehicle (lane 2), 1 mM dbcAMP (lane 3), or 20 μM retinoic acid (RA) (lane 4); lanes 5 and 6, a stable transfectant of Neuro-2a cells with pTRE-FLAG-mNax (N2a-Mf1) maintained under serum-free conditions (lane 5) and N2a-Mf1 cells infected with the Tet-off adenovirus for the expression of FLAG-mNax (lane 6). The parental N2a cells were Nax-negative. GAPDH was amplified from the same cDNA preparation as Nax. (B) Western blotting with anti-mNax. Cells were cultured as in A. The lower panel shows Coomassie Brilliant Blue (CBB) staining to verify the amount of protein applied. (C and D) Anti-Nax immunocytochemistry of cells cultured as in A using a wide-field fluorescence microscope (C) and confocal laser scanning microscope (D). PhC, phase contrast; DIC, differential interference contrast image. Scale bars, 20 μm for (C) and 10 μm for (D). (E) Na+ imaging to confirm the functional expression of FLAG-tagged Nax in N2a-Mf1 cells. C6M16 cells expressing non-tagged mouse Nax and C6Mf4 cells expressing FLAG-tagged Nax were analyzed to determine whether the FLAG tag affected the gating of Nax channels. C6M16, C6Mf4, and N2a-Mf1 cells showed similar [Na+]o-sensitive responses. Their parental N2a and C6 cells, which were Nax-negative, did not show [Na+]o-sensitive responses. The ordinate shows the change observed in the fluorescence ratio (ΔF, 340/380 nm). The fluorescence ratio at 0 min was set as the zero point on the ordinate. The extracellular perfusion solution was changed from the 145 mM Na+ solution to the 170 mM Na+ solution at 0 min. Data represent the mean ± SE (n = 25 for each). Uncropped images of gels and blots are shown in S3 Fig.

