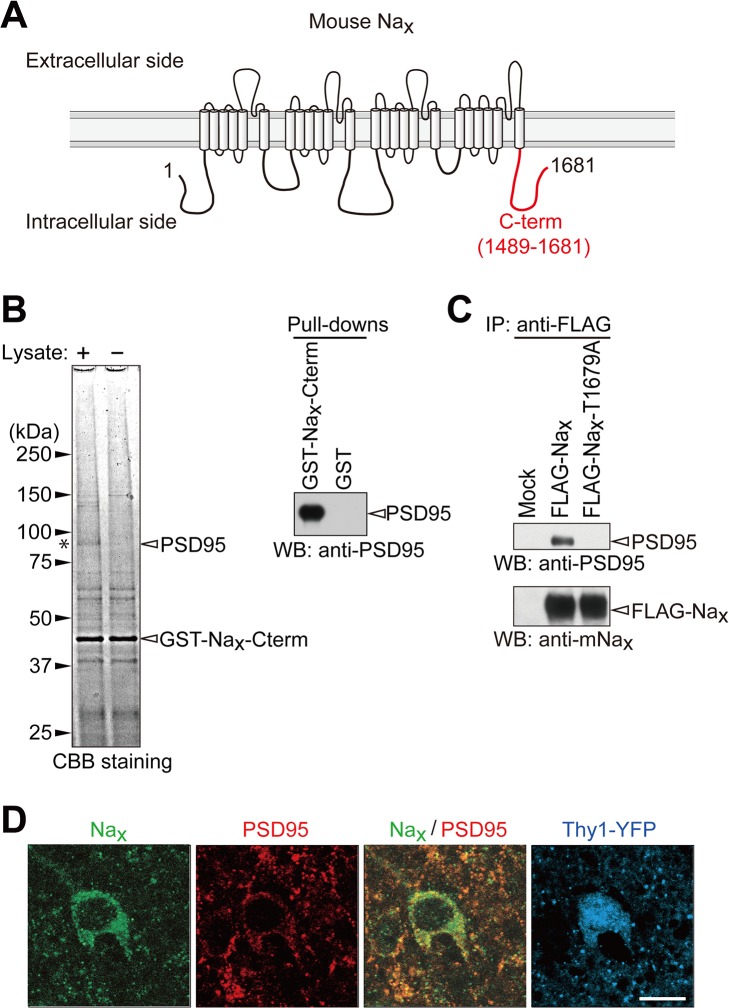
Fig 5. Nax binds to PSD95 via its C-terminal PDZ-domain binding motif.
(A) Schematic diagram of mouse Nax. The C-terminal region used for the pull-down experiment is indicated by a red line. Numbers refer to amino acid residues. (B) GST pull-down assays. Left, CBB-stained gel of pull-down samples. The asterisk indicates the main band, which was specifically detected in the pull-down samples using GST-Nax-Cterm. The main band at 95 kDa was identified as PSD95 by mass spectrometry. Right, Western blot analyses of pull-down samples from the synaptosome fraction of the rat cortex using GST-Nax-Cterm. Western blotting was performed with an anti-PSD95 antibody. (C) Binding of full-length Nax to PSD95 in HEK293T cells. The expression construct for PSD95 was transfected into HEK293T cells, together with the control vector (Mock), FLAG-tagged wild-type Nax, or its FLAG-tagged PDZ-binding-motif mutant. The upper box shows the sequence of the PDZ-binding motif of mouse Nax and its mutant. The lower panels show immunoprecipitation. The amounts of protein immunoprecipitated with anti-FLAG M2 were analyzed by Western blotting using anti-PSD95 and anti-mNax antibodies. The amounts of protein expressed in the cell extract were shown in S1 Fig. (D) Immunohistochemical staining of the lateral amygdala in the Thy1-YFP mouse with anti-mNax (green) and anti-PSD95 (red). The fluorescence signals of YFP are indicated in blue. YFP was expressed in a subset of neurons in the brain of the Thy1-YFP mouse. Scale bars, 10 μm. Uncropped images of blots are shown in S1 and S3 Figs.

