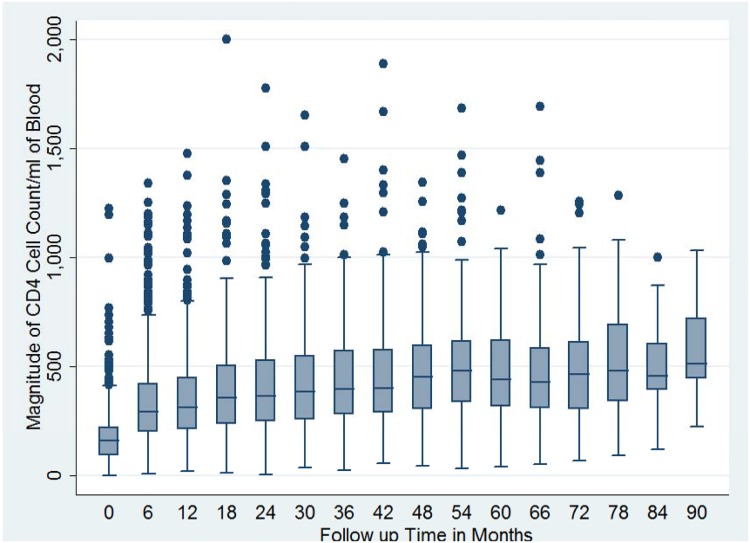
Fig 3. Box plot for magnitude of baseline and follow-up CD4 cell count among cohort of patients on anti-retroviral therapy by follow-up month (N = 1,321).
The group level CD4 cell count as measured by median CD4 cell count at a particular follow-up time is seen to increase at first and plateau then after.

