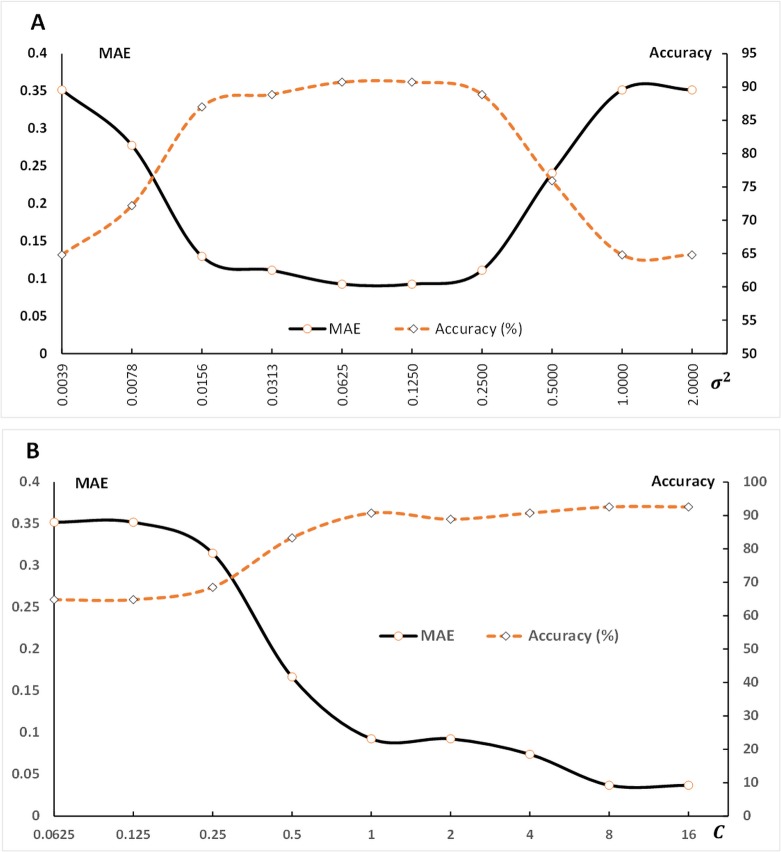
Fig 3. The prediction performance comparison based on the MAE and forecasting accuracy.
Fig 3 (A) shows the MAE and the prediction accuracy with varying values of σ 2 while C was fixed. In contrast, the value of C was varied and σ 2 was fixed in Fig 3 (B) to determine the optimal values for the MAE and prediction accuracy.

