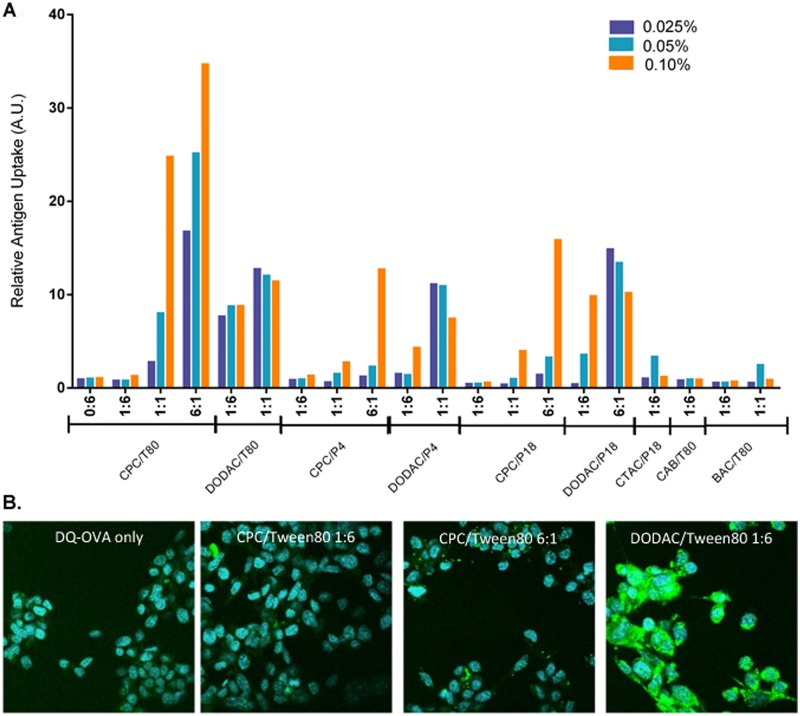
Fig 3. NE facilitated uptake of DQ-OVA in TC-1 epithelial cells.
(A) TC-1 cells were incubated with the indicated NE concentrations and DQ-OVA for 2 h at 37°C. Cellular fluorescence was measured by flow cytometry. Relative antigen uptake is expressed as fold fluorescence (MFI at ex 488 nm, em 533 nm) increase relative to that of cells treated with DQ-OVA alone. Representative NE formulations with increasing cationic:nonionic surfactant ratios are shown. (B) Confocal fluorescence microscopy of TC-1 cells incubated with 10 μg/mL of DQ-OVA alone or with 0.05% of the indicated NE for 2 h at 37°C. Nuclei were stained with DAPI (blue), intracellular and proteolytically processed DQ-OVA (green).

