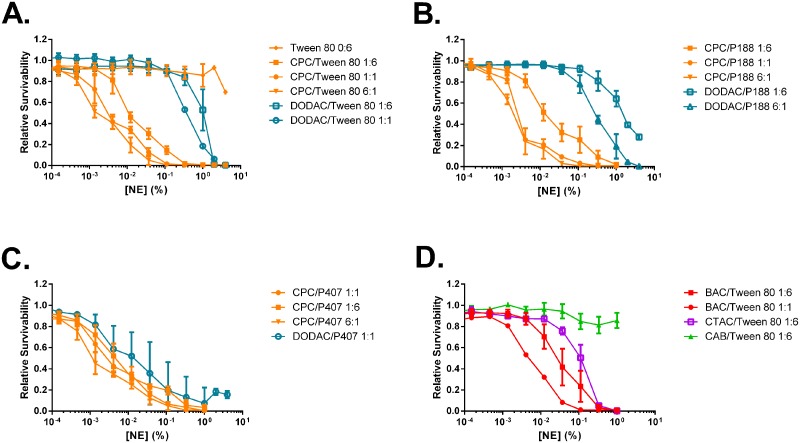
Fig 4. NE induced cytotoxicity for TC-1 cells.
Cells were treated for 24 h with increasing concentrations of NE at 37°C. Cytotoxicity was measured with a CellTiter-Glo luminescent cell viability assay. Data for representative NEs grouped by nonionic surfactant are shown. Viability curves for NEs containing (A) Tween80, (B) P188, and (C) P407 with CPC or DODAC cationic surfactants, and for NEs containing (D) Tween80 with BAC, CTAC, and CAB. Curves shown are the average of two independent experiments ± SD.

