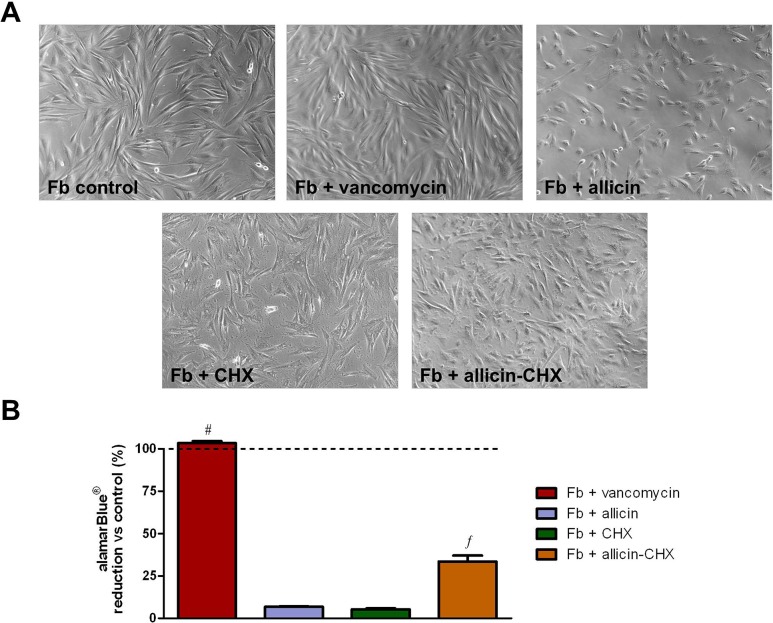
Fig 5. Cell viability.
(A) Micrographs of the cultured fibroblasts after a 24 h exposure to the different antibacterial treatments (original magnification 100x). (B) Mean percentage of the alamarBlue reduction from cells treated with the antibacterial solutions vs non-treated cells after 24 h of culture. The results are expressed as the mean ± SEM for 3 independent assays performed in quadruplicate. #: Fb + vancomycin vs Fb + allicin, Fb + CHX, Fb + allicin-CHX (p<0.001). ƒ: Fb + allicin-CHX vs Fb + allicin, Fb + CHX (p<0.001).

