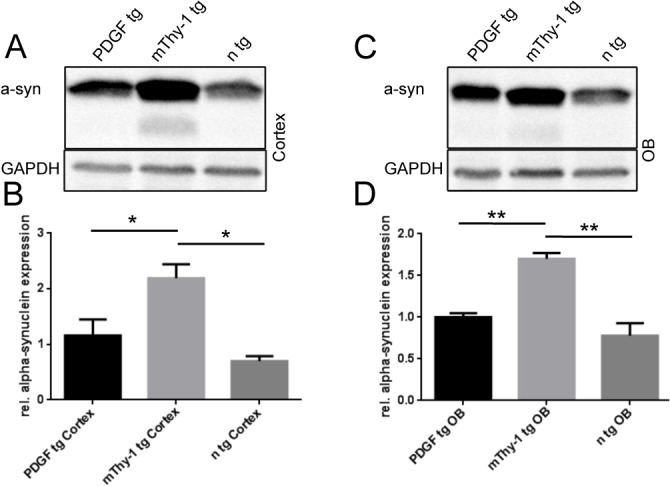
Fig 4. Western blot (WB) analysis of a-Synuclein protein levels.

mThy1 and PDGF transgenic a-Synuclein mice and non transgenic littermates (n tg) are compared: (A, C) WB and (B, C) densitometric analysis (normalized against GAPDH) shows a significant increase in a-Synuclein expression in mThy1 mice both in the cortex (A, B, *<0.05, n = 3 replicates, data shown as means ± SEM) and in the olfactory bulb (C, D, *<0.005).
