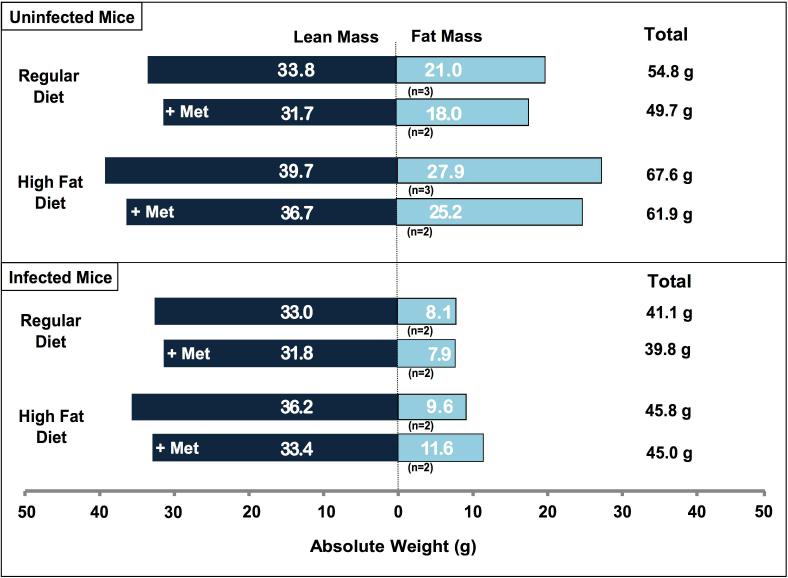
Figure 4.
Body composition. Body composition, measured by magnetic resonance spectroscopy, was carried out on live mice (without anaesthesia) to measure fat mass and lean (fat free) mass. The measurements were conducted 70 days post-infection. Mice were selected for body composition studies by choosing those that were at or closest to median weight in each experimental group. (A) In uninfected mice, there was a statistically significant difference in lean mass (p=0.0038) and total weight (p=0.0038) amongst the four diet/treatment groups. No such difference was detected in fat mass (p=0.1208), percent fat mass (p=0.6217) or percent lean mass (p=0.5230). (B) Amongst infected mice, there was a significant difference in total weight amongst the groups (p=0.0095) but not in fat mass (p=0.4762), lean mass (p=0.5619), percent fat mass (p=0.3429) or percent lean mass (p=0.6857).

