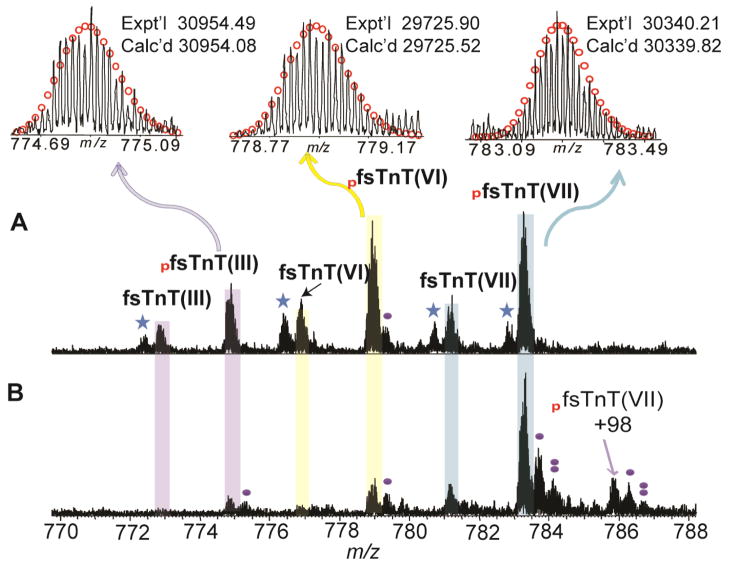
Figure 4. High-resolution FTICR-MS analysis of fsTnT from human skeletal muscle biopsies.
(A) LC purified sTnT from human vastus lateralis muscle; (B) LC purified sTnT from human tibialis anterior muscle. Representative FTICR-MS spectra of human fsTnT, M40+ for fsTnT(III), M39+ for fsTnT(VI), M38+ for fsTnT(VII), respectively. Red circles represent theoretical isotopic abundance distribution of the isotopomer peaks. Solid circle(s) represents oxidation species. Star represents potential water loss (-18 Da). Calc’d, calculated most abundant mass; Expt’l, experimental most abundant mass. +98 represents the non-covalent phosphate adduct ((H3PO4, +98 Da). pfsTnT (III), pfsTnT (VI), and pfsTnT(VII) represents mono-phosphorylated fsTnT isoform III (P45378-3), isoform VI (P45378-6) and isoform, VII (P45378-7), respectively.

