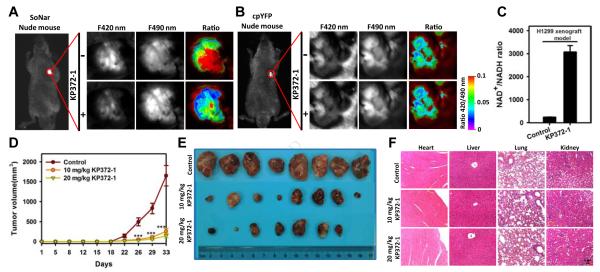
Figure 4. KP372-1 induces NADH oxidation and impairs tumor growth in vivo without apparent toxicity.
(A and B) In vivo ratiometric fluorescence imaging of H1299 xenografts expressing SoNar (A) or cpYFP (B) in response to KP372-1. Images were pseudocolored with the ratio of fluorescence excited at 420 nm and 490 nm. Scale bar, 2 mm. (C) Quantification of the NAD+/NADH ratio in H1299 xenografts according to SoNar fluorescence. Error bars represent SD. (D) H1299 tumor-growth curves of untreated or KP372-1-treated mice. Error bars denote SEM (n=8 in each group). (E) Photographs of tumors after dissection at day 33. (F) H&E staining for the indicated tissues in animals treated with vehicle, 10 mg/kg KP372-1, or 20 mg/kg KP372-1 daily for 33 days. See also Figure S4 and Table S3.

