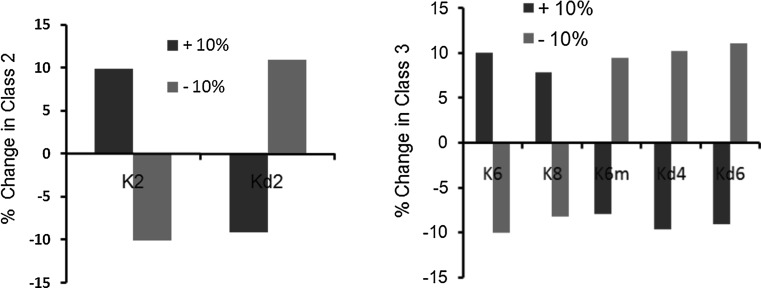
Fig. 8.
Sensitivity analysis. Class 2 (left) and class 3 (right) expression values on making 10 % change in the parameter values. Red bars indicate change in steady state value after increasing the parameter value by 10 %, and green bars indicate the change in steady state value after decreasing the parameter value by 10 %. Changing values of all other model parameters resulted in <10 % change (data not shown). Kd2 is the degradation constant of class 2 genes. Kd4 and Kd6 are the degradation constants of FliA and Class 3 proteins respectively

