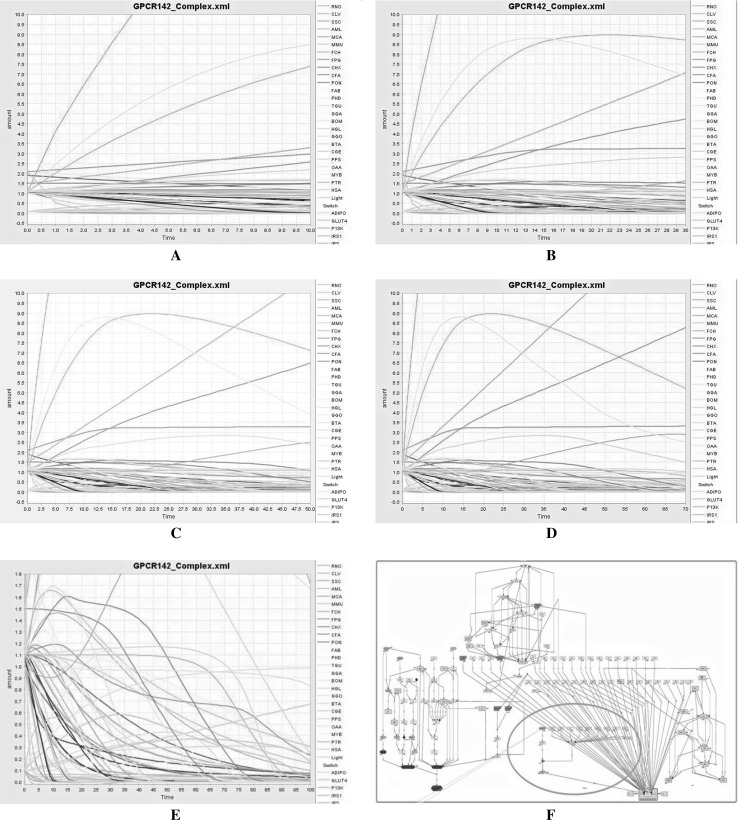
Fig. 3.
Kinetic simulation of whole systems where GPR142 protein interact to Type 2 diabetes, different–different lines are represents the concentration amount of different species, where X axis represents the time of simulation and Y axis represents the concentration amount of species (gene, proteins and other molecules). (Color figure online)

