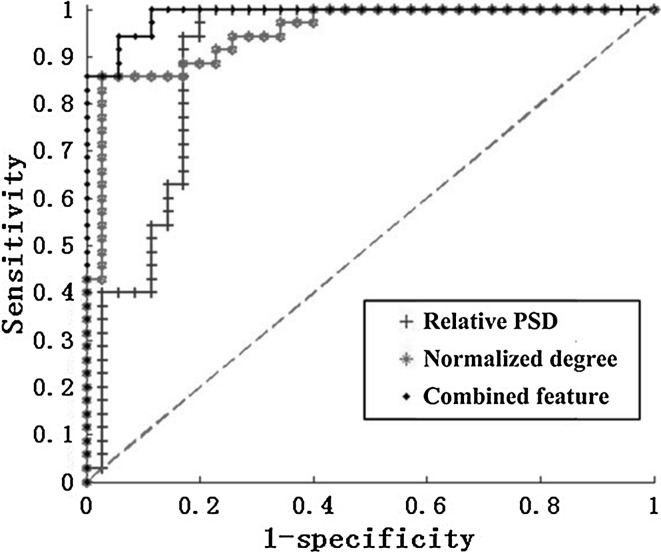
Fig. 11.
ROC curves which assesses the classification performance between AD patients and the normal controls in the alpha2 frequency band with the relative PSD, the normalized degree, and the combined feature. Moreover, the green dotted line is known as the “no-discrimination line” and corresponds to a classifier which returns random guesses. (Color figure online)

