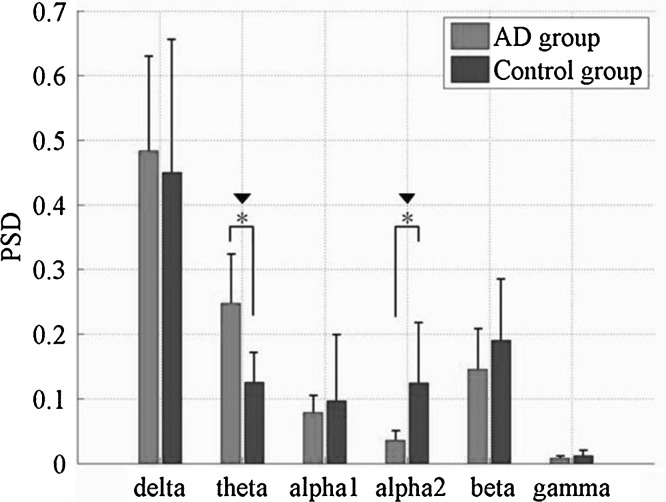
Fig. 4.
Relative PSD averaged over the 16 electrodes in six frequency bands for AD and the control group. Standard deviations are shown with error bars. Asterisk and black down-pointing triangle represent significant difference between the two groups with P < 0.01 after ANOVA and P < 0.00167 after statistical postcorrection

