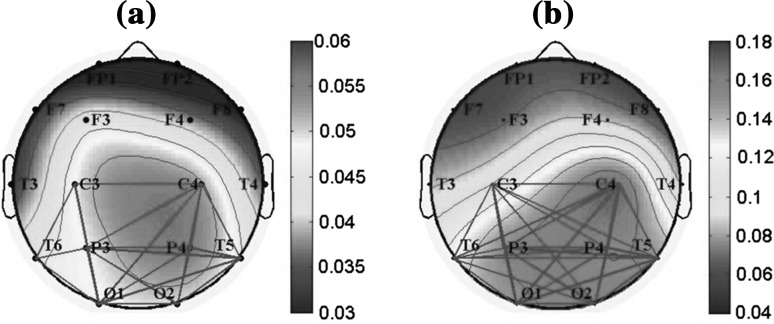
Fig. 7.
Topographic maps of the relative PSD in the alpha2 frequency band for (a) AD group and (b) the control group. Meanwhile, the local functional connections based on coherence are shown between the electrodes with high relative PSD values in red color: C3, C4, P3, P4, O1, O2, T5, and T6. Here, the threshold is 0.34. When the coherence value between two electrodes is larger than 0.34, an edge in gray is existed. (Color figure online)

