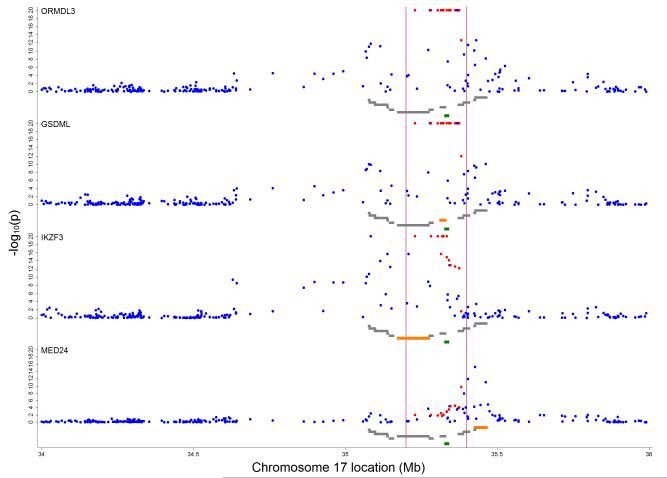
Figure 4.
Inverse log10 transformed P-values for crude associations of 257 independent SNPs between 34 and 36 Mb on chromosome 17 with gene specific expression levels. Vertical red lines delineate region between 35.2 and 35.4 Mb around ORMDL3 (marked in green) containing 13 asthma-related SNPs 5, 22, 23 (highlighted in red). Grey gene tracks show loci in the order PNMT, PERLD1, ERBB2, C17orf37, GRB7, IKZF3, ZPBP2, GSDML, GSDM1, PSMD3, CSF3, MED24 with the reported marker in orange. Figure shows results for ORMDL3, GSDML, IKZF3 and MED24.

