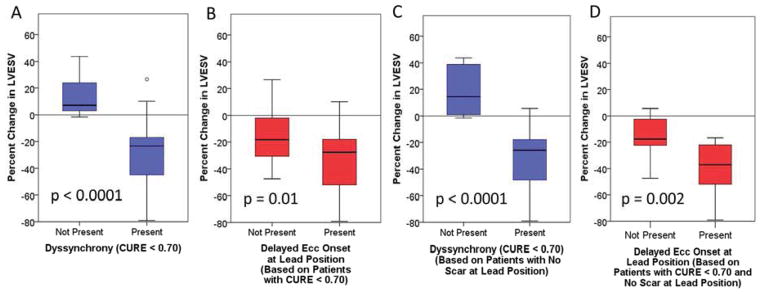
Figure 4. Box Plots for CRT Response in Selected.

Subgroups -- A) Greater CRT response is present with CURE < 0.70. B) Greater CRT response is present with delayed ECC onset at the LVLP among patients with CURE < 0.70. C) Differences in CRT response with CURE < 0.70 (as shown in panel A) including only patients without LVLP scar. D) Compared with panel B, patients without scar at the LVLP and CURE < 0.70 have even more pronounced differences in CRT response based on the presence or absence of delayed ECC onset.
