
Figure 6.
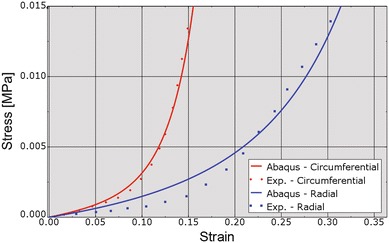
Fit of leaflet stress–strain relationships (red indicates circumferential, blue indicates radial) to experimental data. “Exp” stands for experimental. True (Cauchy) stress and true (logarithmic) strain are plotted in this figure
Official websites use .gov
A
.gov website belongs to an official
government organization in the United States.
Secure .gov websites use HTTPS
A lock (
) or https:// means you've safely
connected to the .gov website. Share sensitive
information only on official, secure websites.
Fit of leaflet stress–strain relationships (red indicates circumferential, blue indicates radial) to experimental data. “Exp” stands for experimental. True (Cauchy) stress and true (logarithmic) strain are plotted in this figure