
Figure 7.
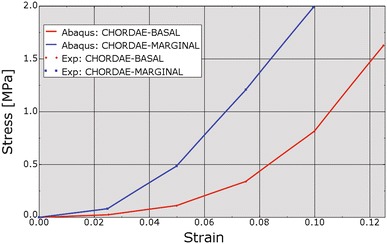
Fit of chordae stress–strain relationships to experimental data. Red line indicates basal chordae; blue line indicates marginal chordae. “Exp” stands for experimental. True (Cauchy) stress and true (logarithmic) strain are plotted in this figure