
Fig. 1.
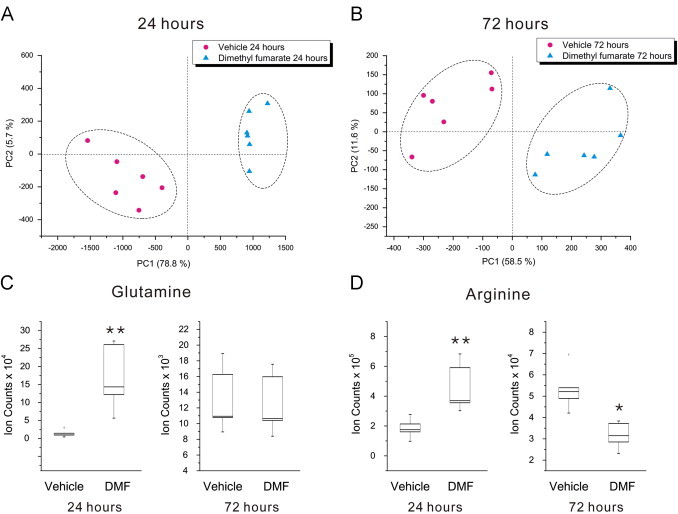
DMF treatment alters oligodendrocyte metabolism. Principal component analysis of the metabolic alterations associated with 10 µM DMF treatment at 24 (A) and 72 h (B). (C) Box and whisker plot of glutamine, showing significant upregulation after 24 h treatment (p=0.002, q=0.007), but a return to control levels by 72 h (p=0.89, q=0.13). (D) Box and whisker plot of arginine, which is increased at 24 h (p=0.002, q=0.05), but downregulated after 72 h of DMF treatment (p=0.02; q=0.012). *q-value <0.05, **q-value <0.01; N=6 replicates per group, representative of two separate experiments.