
Fig. 2.
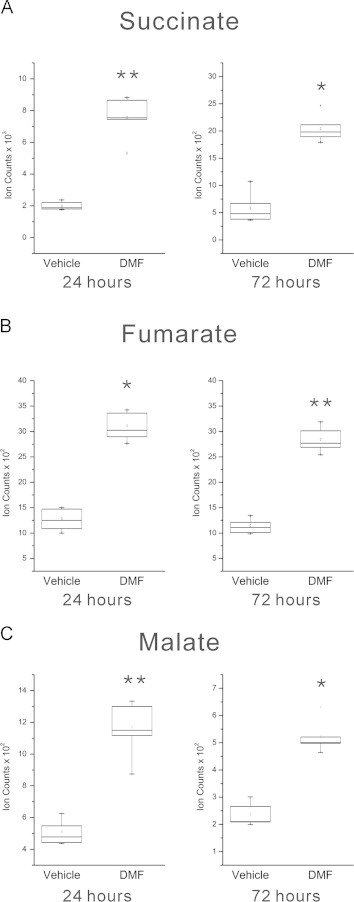
DMF treatment perturbs TCA cycle metabolism in oligodendrocytes. Box and whisker plots for succinate (A), fumarate (B), and malate (C) all showing upregulation after DMF treatment for 24 and 72 h compared to vehicle-treated controls (succinate p=0.004, q=0.009 at 24 h, p=0.046; q=0.021 at 72 h; fumarate p=0.017, q=0.020 at 24 h, p = 0.001, q=0.002 at 72 h; and malate p=0.002; q=0.003 at 24 h, p=0.020, q=0.040 at 72 h). *q-value <0.05, **q-value <0.01; N=6 replicates per group, representative of two separate experiments.