
Figure 1.
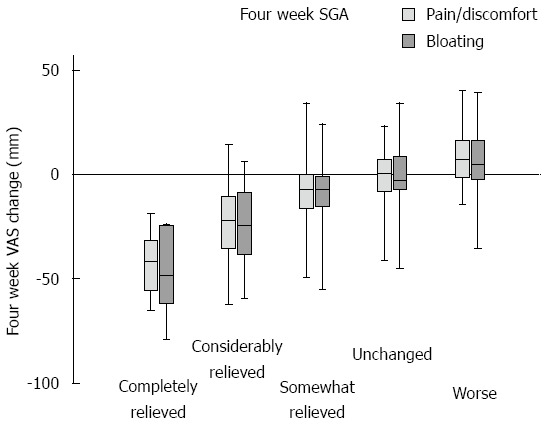
Scale and precision of the subjective global assessment measure. At 4 wk, the change in VAS registration (compared to pre-registration values) was calculated. Box and whiskers plot of VAS change in the different subcategories of SGA at 4 wk. It is noted that the scale is not entirely linear, with best discrimination in the left part of the plot, while the right part shows smaller VAS differences between groups. SGA: Subjective global assessment; VAS: Visual analog scale.