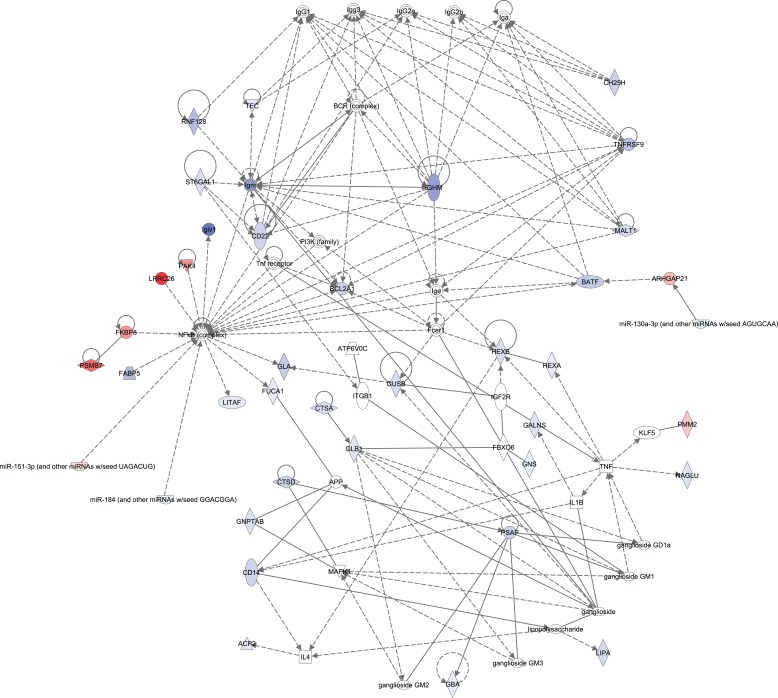
Figure 3.
A biological network capturing the immune response and the metabolism of glycosaminoglycan and sphingolipid revealed from Ingenuity Pathway Analysis® (IPA®). Molecules in the network represent the genes that were expressed in a different manner in tumor compared to surrounding non-tumorous parenchyma tissues following MS-300 exposure (significant interaction analysis). Blue and red indicate significantly decreased and increased fold change, respectively, of the gene expression affected by cigarette smoke in the tumors as compared to the parenchyma and sham controls. Color intensity qualitatively represents the degree of fold change. Straight and dashed lines specify direct and indirect interaction, respectively.

