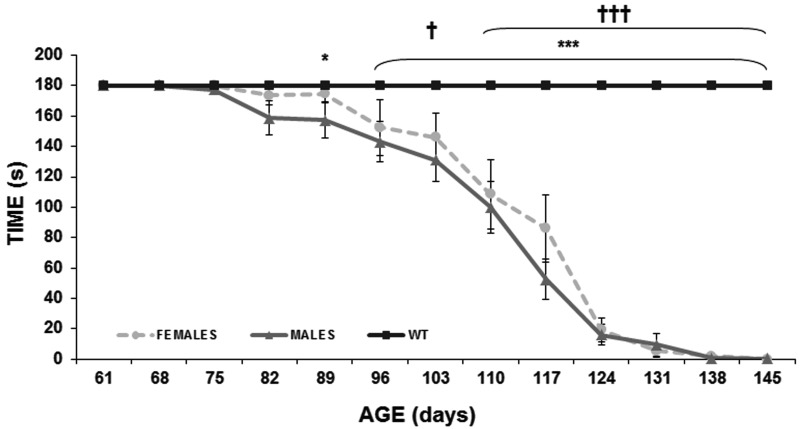
Fig. 2.
Rotarod test. Changes over time in rotarod test performance of male (black) and female (grey) wild type and transgenic mice (WT males n=10, WT females n=10, transgenic females n=15 and transgenic males n=15). Data are shown as mean ± SEM. *P<0.05 and ***P<0.001 (male mice), †P<0.05 and †††P<0.001 (female mice).

