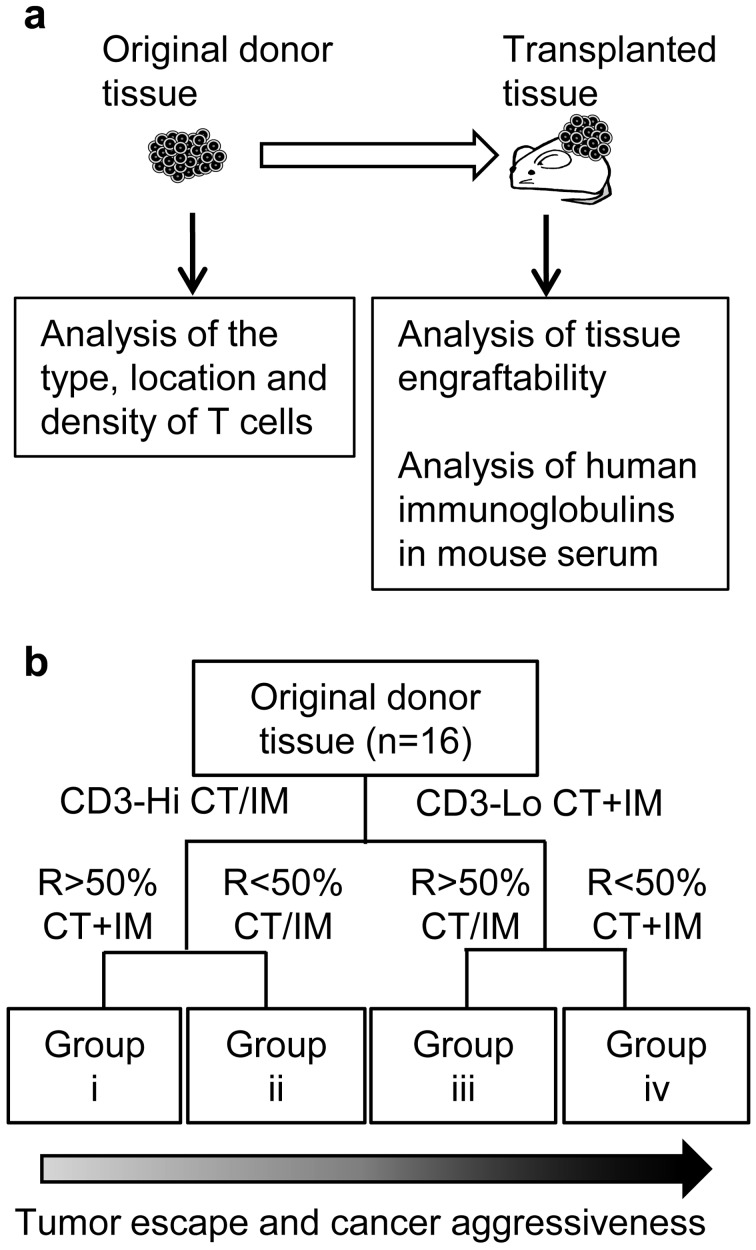
Fig. 1.
Study scheme of archived samples (a). Original donor tissues (tissues before transplant) and xenograft tissues (tissues after transplant) were selected from the tissue archive at PLR and were analyzed in this study. Decision tree for analysis of T cells in original donor tissues (b). The cases were grouped into Groups i to iv according to the analysis of T cells [2]. CT, center of tumor; IM, invasive margin; CT+IM, both CT and IM; CT/IM, CT and/or IM; CD3-Hi, median CD3-positive cell density or higher; CD3-Lo, lower CD3-positive cell density than median. R, ratio of CD8-positive to CD3-positive cell density.

