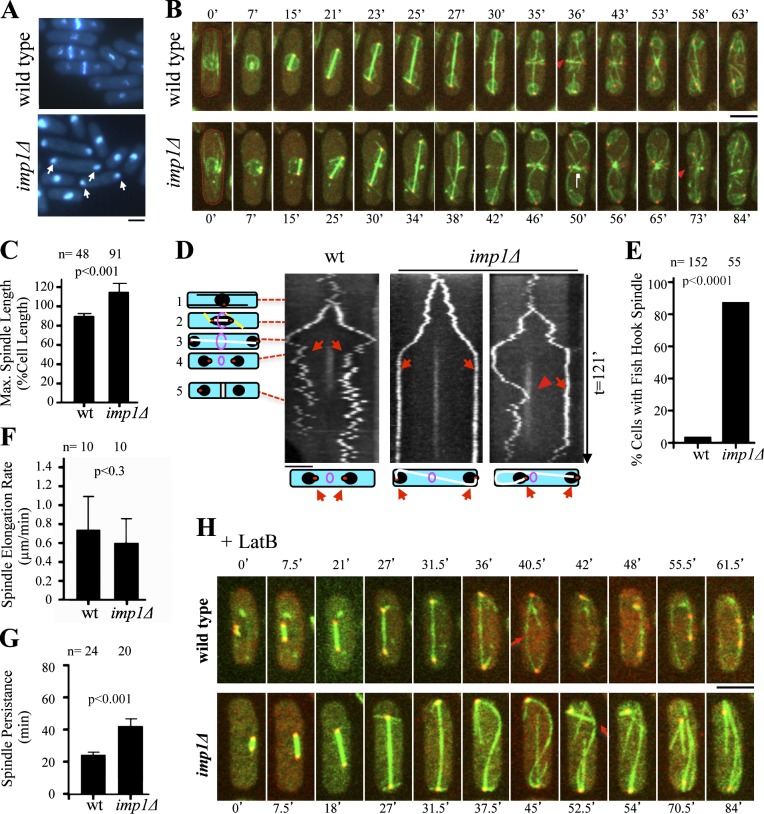
Figure 1.
Imp1 is required for mitotic spindle disassembly. (A) DAPI and Calcofluor white staining of wild-type and imp1Δ S. pombe cells. In asynchronous cultures, 21% of imp1Δ cells show nuclei at the cell tips (arrows), whereas only 9% of these cells are found in the wild-type strain. (B) Time-lapse fluorescence images of GFP-Atb2 (spindle), Cut11-GFP (nuclear envelope), and Sid2-Tom (SPBs and medial division ring) in wild-type and imp1Δ cells. Red arrowheads indicate initiation of spindle disassembly as cytokinesis is initiated in wild-type cells (t = 36 min) and spindle breakdown by the constricting actomyosin ring in imp1Δ cells (t = 73 min). (C) Mean maximal spindle length (percentage of the cell length) in wild-type and imp1Δ cells. (D) Kymographs of wild-type (left) and imp1Δ cells (middle and right) expressing Sid2-Tom. Schematized cells on the left represent cell cycle stages: 1, interphase; 2, early anaphase B; 3, late anaphase B; 4, ring contraction and daughter nuclei reposition; 5, end of cytokinesis. Although nuclei are repositioned in wild-type cells (left, arrows), in imp1Δ cells, hyperextended spindles persisted during cytokinesis (middle, arrows) and eventually, a fishhook-shaped spindle localizes one SPB and its associated nucleus close to the division site (right, arrowhead). Schematized cells (bottom) represent the structure of the corresponding mitotic spindles. (E) Frequency (%) of fishhook-shaped mitotic spindles in wild-type and imp1Δ cells. (F) Spindle elongation rate in wild-type and imp1Δ cells. (G) Average time of mitotic spindle persistence in wild-type and imp1Δ cells. (H) Time-lapse fluorescence images of GFP-Atb2 and Sid2-Tom in wild-type and imp1Δ cells in the presence of latrunculin B. Arrows indicate initiation of spindle disassembly as cytokinesis is initiated in wild-type cells, and spindle breakdown is caused by bending forces in imp1Δ cells. Bars, 5 µm. Graphs represent mean and standard deviation. n is the total number of cells scored from at least three independent experiments.

