Figure 3.
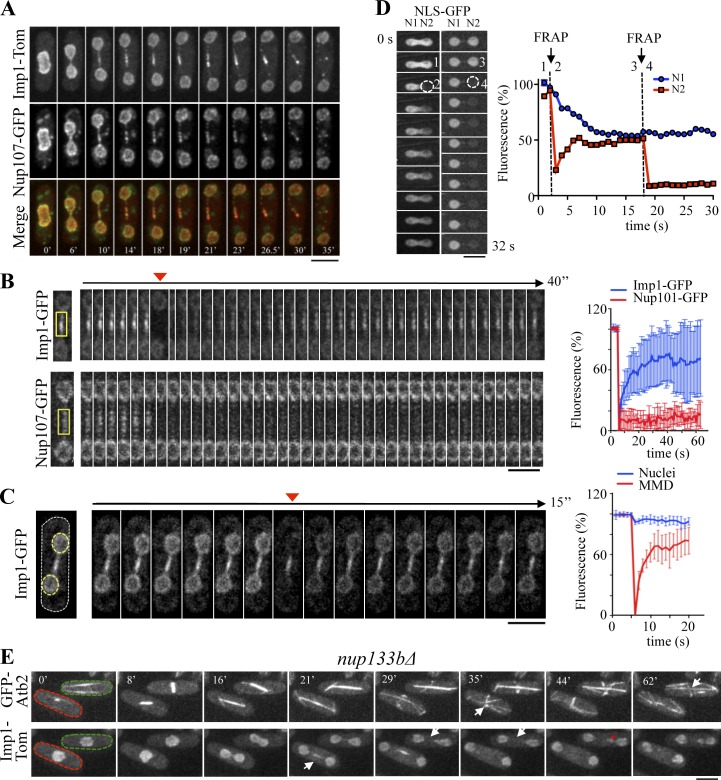
The MMD represents a differentiated nuclear envelope region with nucleocytoplasmic transport activity. (A) Colocalization of Imp1-Tom and the nuclear pore marker Nup107-GFP by time-lapse fluorescence microscopy. (B) FRAP time-lapse images of Imp1-GFP– and Nup107-GFP–expressing cells. Arrowhead indicates image acquired immediately after photobleaching the indicated regions (yellow squares). Time course fluorescence recovery (percentage related to initial fluorescence intensity) is represented (right, n = 8). (C) FRAP time-lapse images of a Imp1-GFP–expressing cell. Arrowhead indicates image acquired immediately after photobleaching both daughter nuclei (yellow-dashed circles). Fluorescence recovery of imp1-GFP signal measured either at spindle midzone (MMD) or at nuclei is shown as a percentage of initial fluorescence (right, n = 5). (D) Photobleaching of nucleoplasmic NLS-GFP (dashed circle) during early (1, prebleach; 2, bleach) and late (3, prebleach; 4, bleach) anaphase B in a representative cell from four independent experiments. Graph represents fluorescence intensity levels (percentage related to initial values) over time in bleached (red) and nonbleached (blue) regions. (E) Time-lapse fluorescence images of nup133bΔ cells coexpressing GFP-Atb2 and Imp1-Tom. The red-dashed cell forms a normal MMD region during anaphase B (arrow at 21 min), which is followed by mitotic spindle disassembly (arrow at 35 min). The green-dashed cell, however, undergoes mitosis without a detectable MMD region (arrow at 29 and 35 min), which correlates with persistence of mitotic spindle at late cytokinesis (arrow at 62 min). In this cell, nuclear missegregation is also observed (asterisk at 44 min), a feature that may explain the abnormal chromosome segregation previously described in this strain (Baï et al., 2004). Bars, 5 µm.

