Figure 4.
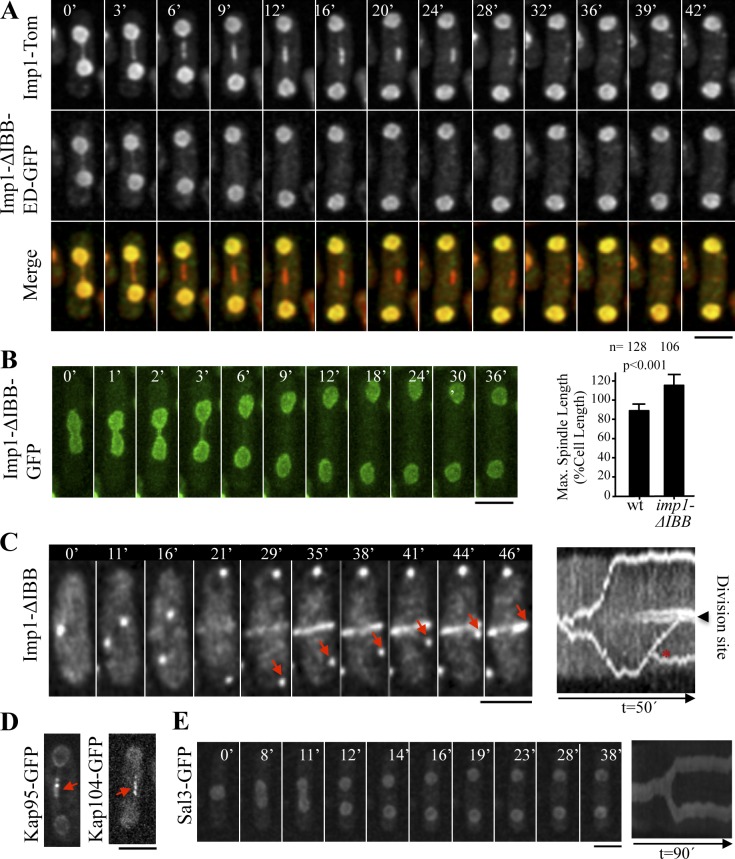
Imp1-mediated transport in the MMD region is importin-β–NLS cargo dependent. (A) Time-lapse fluorescence images of a cell coexpressing Imp1-Tom and Imp1-ΔIBB-ED-GFP. Only Imp1-Tom is found at the MMD. (B) Time-lapse fluorescence images of a cell expressing Imp1-ΔIBB-GFP. (graph) Mean maximal spindle length (percentage of the cell length) in wild-type and Imp1-ΔIBB cells (graph represents mean and standard deviation; n is the total number of cells scored from two independent experiments). (C) Time-lapse fluorescence images of Sid2-Tom in Imp1-ΔIBB cells. Arrows indicate the position of the SPB after cytokinesis is initiated. Kymograph of this cell is shown. Asterisk denotes a signal of a nearby cell. (D) MMD localization (arrows) of Kap95-GFP and Kap104-GFP importin-β proteins during anaphase B. (E) Time-lapse fluorescence images of a cell expressing Sal3-GFP importin-β protein. Kymograph of this cell is shown. Bars, 5 µm.

