Figure 5.
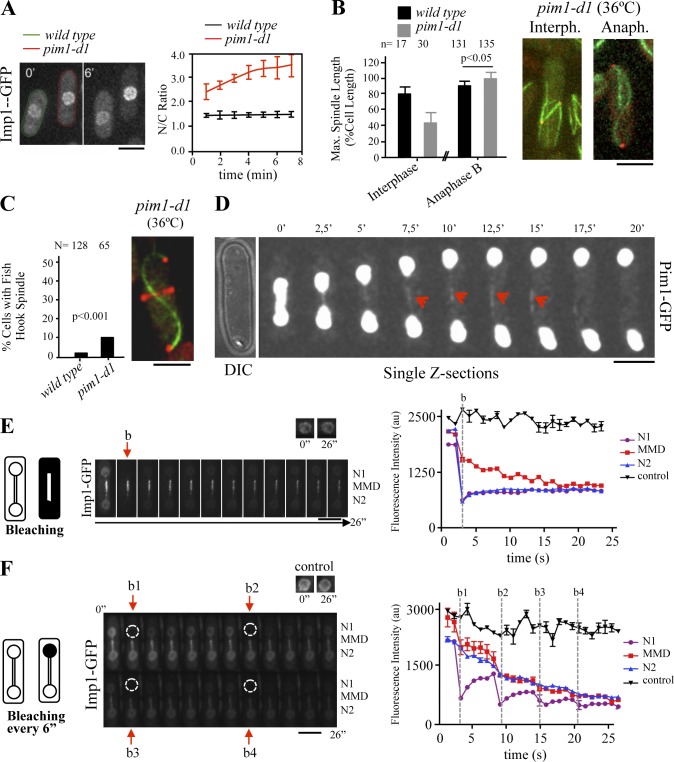
Ran-dependent nucleocytoplasmic transport activity at the MMD. (A) Imp1-GFP localization in wild-type (lectin labeled) and pim1-d1 cells (green- and red-dashed cells, respectively) at 0 and 6 min after temperature shift form 25°C (permissive temperature for pim1-d1) to 36°C (restrictive temperature for pim1-d1). Time course accumulation of Imp1-GFP at the nucleus (ratio of nuclear to cytoplasmic fluorescence intensity) in wild-type (lectin labeled) and pim1-d1 cells after temperature shift from 25°C to 36°C (graph represents mean and standard deviation of at least six cells scored from three independent experiments). (B) Maximal spindle length (percentage of the cell length) in wild-type and pim1-d1 cells after temperature shifting during either interphase or anaphase B (graph represents mean and standard deviation; n is the total number of cells scored from at least three independent experiments). Fluorescence images of representative interphase and anaphase B pim1-d1 cells (at 36°C) expressing GFP-Atb2 and Sid2-Tom are shown. (C) Frequency (%) of fishhook-shaped mitotic spindles in wild-type and pim1-d1 (at 36°C) cells (graph represents mean and standard deviation; n is the total number of cells scored from three independent experiments). Representative fishhook-shaped mitotic spindles in a pim1-d1 GFP-atb2 sid2-Tom cell (at 36°C) is shown. (D) Time-lapse fluorescence images of a representative Pim1-GFP cell. Single z-sections in which Pim1-GFP signal can be observed at the MMD (arrowhead) are shown. (E) Time-lapse fluorescence images of Imp1-GFP–expressing cells. Arrow (b) indicates image acquired immediately after photobleaching Imp1-GFP in the entire cell, except the MMD compartment (see schematized cells). Graph shows time course fluorescence intensity (FLIP assay, arbitrary units) in both nuclei and the MMD region (N1, N2, and MMD, respectively) in a representative cell of at least four cells scored in three independent experiments. Nonbleached nucleus is used as a control. (F) Time-lapse fluorescence images of Imp1-GFP–expressing cells. Arrows (b1–4) indicate image acquired immediately after photobleaching Imp1-GFP in one of the nucleus (dashed circles; see schematized cells). Graph shows time course fluorescence intensity (FLIP assay, arbitrary units) in the MMD compartment and the flanking nuclei (MMD, N1, and N2, respectively) in a representative cell of at least four cells scored in three independent experiments. Nonbleached nucleus is used as a control. Bars, 5 µm.

