Figure 6.
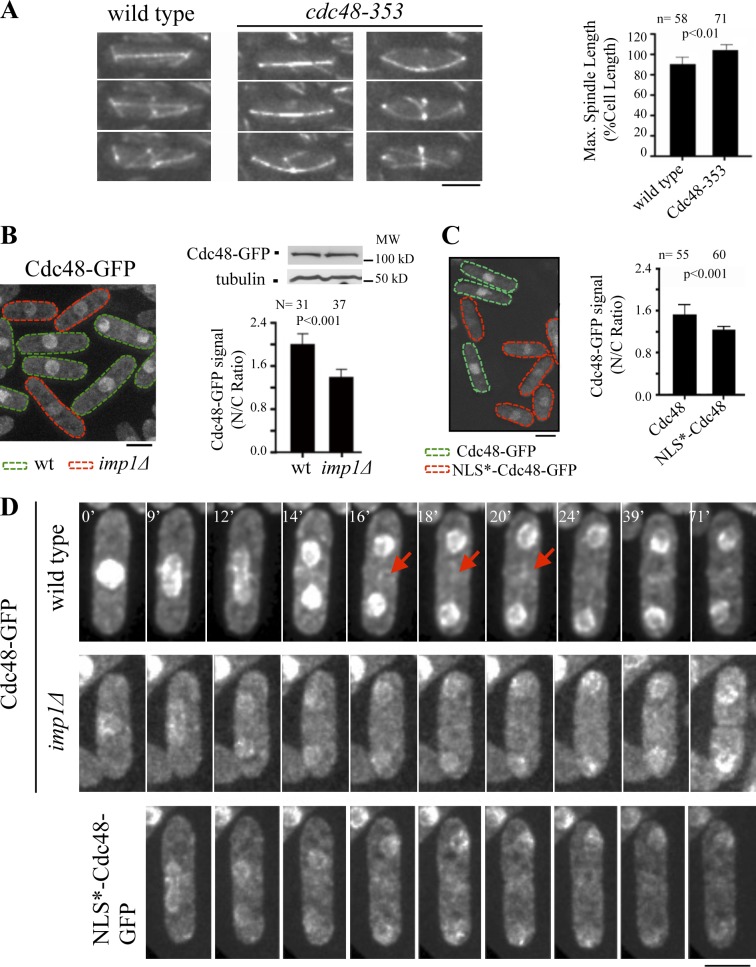
Imp1-dependent transport of the AAA-ATPase Cdc48 protein. (A) Time-lapse fluorescence images of wild-type and cdc48-353 cells expressing GFP-Atb2 at 32°C (semi-restrictive temperature for the cdc48-353 strain) as cells enter cytokinesis. (graph) Mean maximal spindle length (percentage of the cell length) in wild-type and cdc48-353 cells at 32°C. (B) Cdc48-GFP localization in asynchronous wild-type (lectin labeled) and imp1Δ cells (green- and red-dashed cells, respectively) incubated at 25°C. (graph) Quantification of Cdc48-GFP signal at the nucleus (ratio of nuclear to cytoplasmic fluorescence intensity) in asynchronous wild-type (lectin labeled) and imp1Δ cells. Western blot analysis of Cdc48-GFP (tubulin is used as a control) in cell extract of both strains is shown. (C) Cdc48-GFP localization in asynchronous Cdc48-GFP (lectin labeled) and NLS*-Cdc48-GFP (inactivated NLS) cells (green- and red-dashed cells, respectively) incubated at 25°C. (graph) Quantification of Cdc48-GFP signal at the nucleus (ratio of nuclear to cytoplasmic fluorescence intensity) in asynchronous Cdc48+ (lectin labeled) and NLS*-Cdc48 mutant cells incubated at 25°C. (D) Localization of Cdc48-GFP by time-lapse fluorescence in wild-type (top) and imp1Δ cells (middle). Arrows indicate Cdc48 midzone localization in wild-type cells. Localization of NLS*-Cdc48-GFP by time-lapse fluorescence in wild-type background (bottom). Bars, 5 µm. Graphs represent mean and standard deviation. n is the total number of cells scored from at least three independent experiments.

