Figure 7.
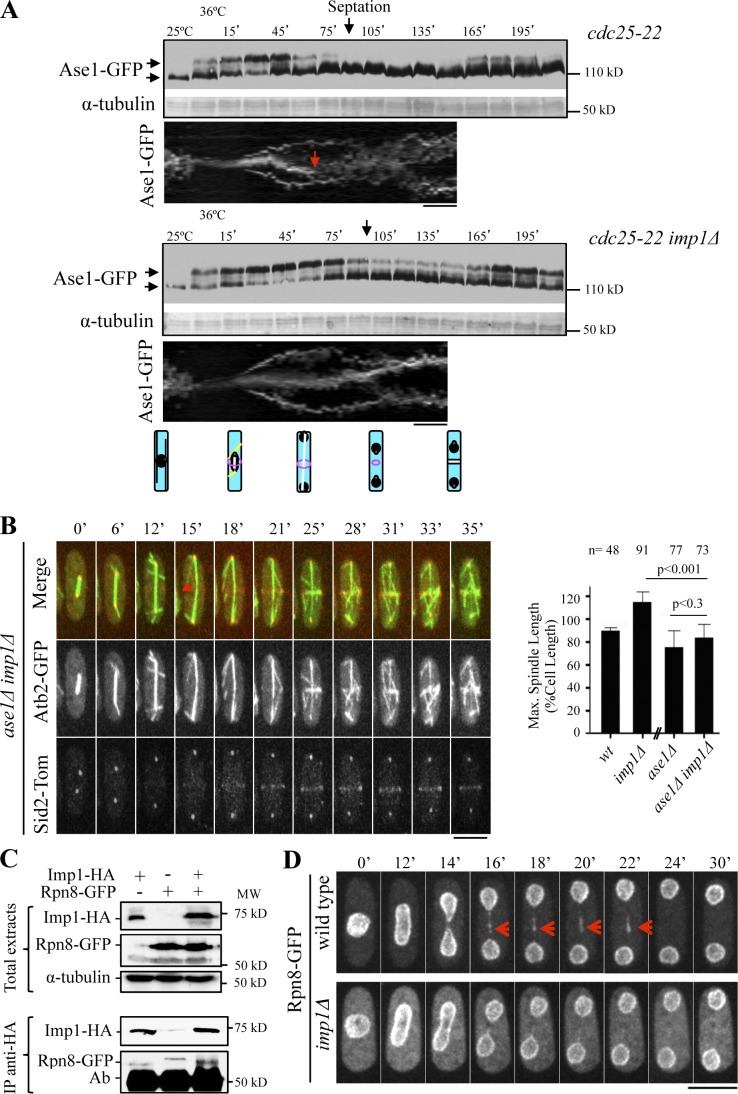
Imp1-dependent levels of the spindle-stabilizing protein Ase1. (A) Western blot analysis of Ase1-GFP protein levels through the cell cycle in synchronized cdc25-22 and cdc25-22 imp1Δ cells. α-Tubulin is used as a control. Maximal septation index values are indicated. Kymographs of cdc25-22 and cdc25-22 imp1Δ cells expressing Ase1-GFP. Red arrow indicates midzone dissolution in cdc25-22 cells. Schematized cells (bottom) representing interphase, early anaphase, late anaphase B, ring contraction and daughter nuclei repositioning, and the end of cytokinesis, respectively, are shown. (B) Time-lapse fluorescence images of ase1Δ imp1Δ cells expressing Atb2-GFP and Sid2-Tom. Arrowhead indicates the initiation of spindle disassembly. (graph) Maximal spindle length in ase1Δ and ase1Δ imp1Δ cells, compared with wild-type and imp1Δ cells (from Fig. 1C). (C) Levels of Imp1-HA and Rpn8-GFP (Western blot analysis) in cells expressing Imp1-HA, Rpn8-GFP, or both tagged proteins in total extracts and in Imp1-HA immunopurified complexes. (D) Time-lapse fluorescence images of Rpn8-GFP in wild-type (top) and imp1Δ (bottom) cells. Arrows indicate Rpn8-GFP midzone localization in wild-type cells. Bars, 5 µm. Graphs represent mean and standard deviation. n is the total number of cells scored from three independent experiments.

