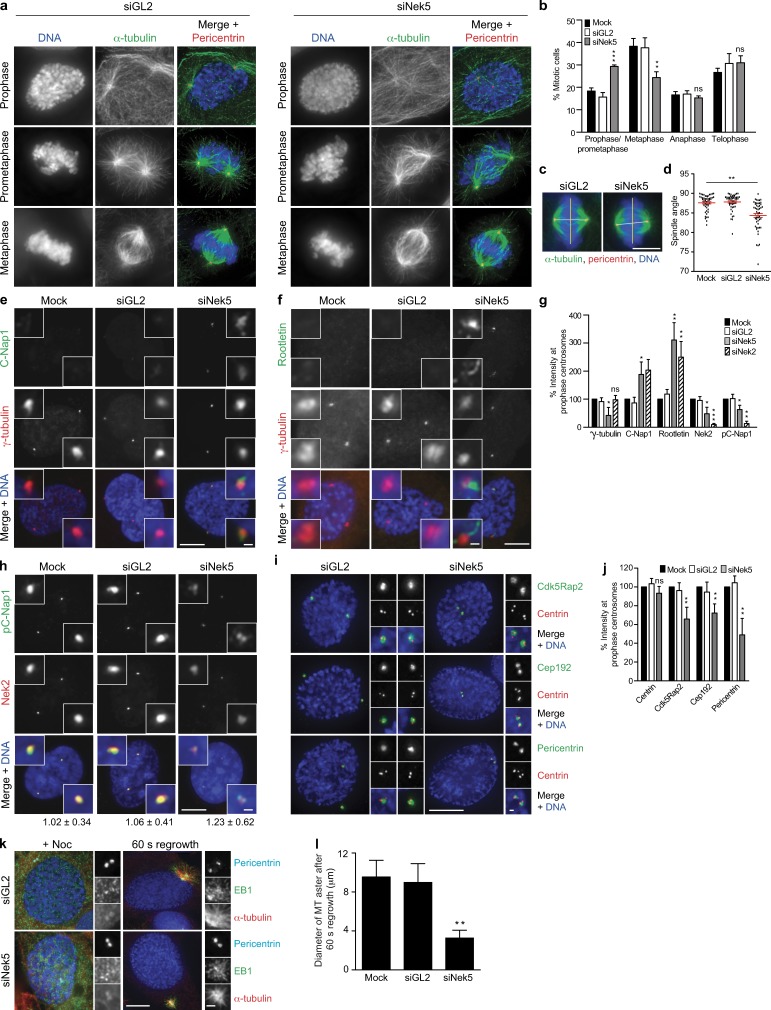
Figure 4.
Nek5 loss leads to retention of centrosome linker proteins and reduced MT nucleation in mitosis. (a) Staining of DNA, α-tubulin, and pericentrin in GL2- and Nek5-depleted cells at the mitotic stages indicated. (b) Histogram of cells in different stages of mitosis, as indicated, after 48 h of mock, GL2, or Nek5 depletion in U2OS cells. (c) Metaphase GL2- and Nek5-depleted cells stained for DNA, α-tubulin, and pericentrin. The yellow line indicates the plane of the metaphase plate; the white line indicates the pole-to-pole spindle axis. (d) Dot plot of the angle between the spindle axis and metaphase plate for mock-, GL2-, and Nek5-depleted cells. Each dot represents a single cell with data collected over two independent experiments, bars represents mean ± SD. (e and f) Staining of C-Nap1 or rootletin and γ-tubulin in prophase U2OS cells after mock, GL2, or Nek5 depletion. (g) Histogram of relative intensities of γ-tubulin, C-Nap1, rootletin, Nek2, and phospho-C-Nap1 (pC-Nap1) in mock-, GL2-, Nek5-, and Nek2-depleted prophase U2OS cells. Each protein was normalized to its intensity in mock-treated cells. (h) Staining of pC-Nap1 and Nek2 in prophase U2OS cells that were mock, GL2, or Nek5 depleted. The ratios of pC-Nap1/Nek2 intensities are indicated. (i) Staining of centrin, Cdk5Rap2, Cep192, and pericentrin in GL2- and Nek5-depleted prophase cells. (j) Histogram of relative intensities of centrin, Cdk5Rap2, Cep192, and pericentrin in prophase U2OS cells that were mock-, GL2-, or Nek5-depleted for 48 h. Each protein was normalized to its intensity in mock-treated cells. (k) Staining of pericentrin, EB1, and α-tubulin in GL2- and Nek5-depleted prophase cells treated with nocodazole for 5 h and 60 s washout to allow MT regrowth. (l) Histogram of the diameter of MT asters formed after 60 s of regrowth in mock-, GL2-, Nek5-, and Cep192-depleted cells. Bars: (a, c, e, f, h, and i, main images) 10 µm; (c) 5 µm; (e, f, h, i, and k, insets) 1 µm. Histograms show mean + SD (error bars); n = 3, 40 centrosomes (l) or 100 cells (b, g, and j) per experiment. *, P < 0.05; **, P < 0.01; ***, P < 0.001.

