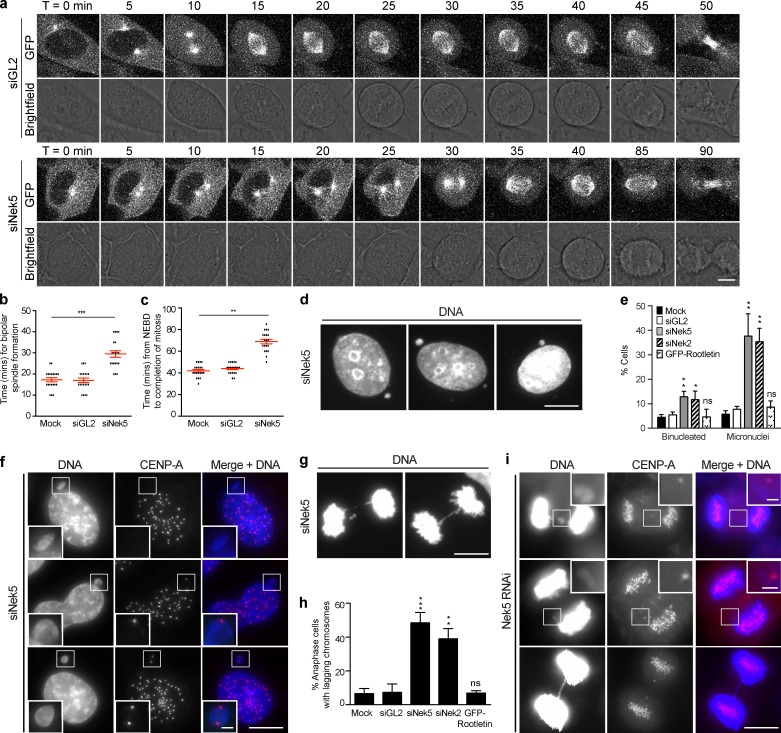
Figure 5.
Nek5 loss leads to delayed centrosome separation and chromosome segregation errors in mitosis. (a) Brightfield and GFP stills from time-lapse imaging of GL2- and Nek5-depleted HeLa cells expressing GFP–α-tubulin. Time is in minutes and t = 0 was defined as the frame in which a distinct MTOC becomes visible. (b) Dot plot of time from when an MTOC becomes visible to bipolar spindle formation in mock-, GL2-, and Nek5-depleted HeLa::GFP–α-tubulin cells. (c) Dot plot of time from nuclear envelope breakdown (NEBD) to anaphase onset in mock-, GL2-, and Nek5-depleted HeLa::GFP–α-tubulin cells. (d) DNA stain in U2OS cells depleted of Nek5 for 48 h. (e) Histogram of interphase U2OS cells that were binucleated or contained micronuclei after mock, GL2, Nek5, or Nek2 depletion or GFP-rootletin overexpression. (f) Interphase Nek5-depleted U2OS cells stained for DNA and CENP-A. (g) Anaphase Nek5-depleted U2OS cells stained for DNA. (h) Histogram of anaphase cells with lagging chromosomes after mock, GL2, Nek5, or Nek2 depletion or GFP-rootletin overexpression. (i) Anaphase Nek5-depleted U2OS cells stained for DNA and CENP-A. Bars: (a, d, and f, main images) 10 µm; (g and i, main images) 5 µm; (f and i, insets) 1 µm. Histograms show mean + SD (error bars); n = 3, 100 cells per experiment. For dot plots, each dot represents a single cell with data collected over two independent experiments; bars represent mean ± SD. *, P < 0.05; **, P < 0.01; ***, P < 0.001.

