
Figure 4.
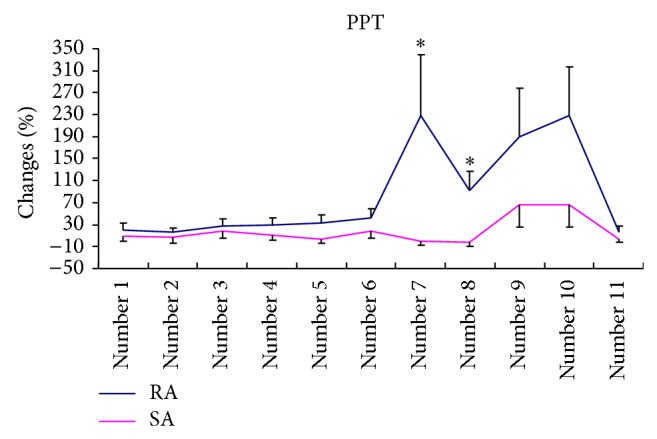
The percentage change of PPTs at 11 sites in the two groups after the treatment (mean and SE, RA, n = 26, and SA, n = 24). ∗ indicates that at the end of treatment, the mean percentage changes in PPTs of sites Numbers 7 and 8 in RA were significantly larger than those in SA.