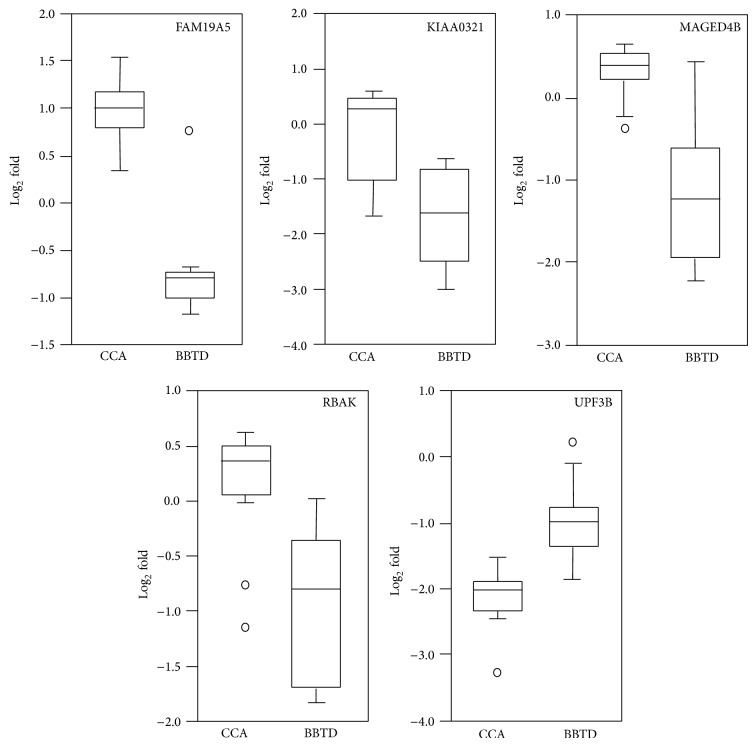
Figure 5.
Comparison of the top five differentially expressed proteins between BBTDs and CCA. Normalized log2-transformed data were used to create box plots, in which the horizontal lines of each box correspond to the first, second, and third quartiles (25%, 50%, and 75%, resp.) and the whiskers correspond to the maximum and minimum values.

