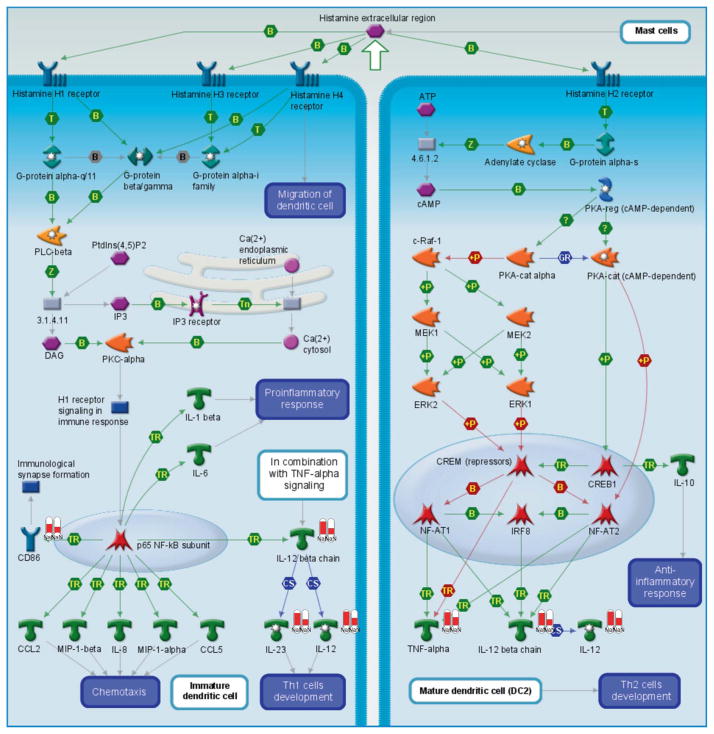
FIGURE 3.
Pathway map of the histamine receptor response in dendritic cell. Many of the genes identified as significantly different in our dataset are involved in this pathway. These differentially expressed factors from experimental data are depicted as white columns with red bars, the height of the red bar is proportionate to the fold change as a result of TiO2 exposure in pregnant (left) vs normal (right) mice.

