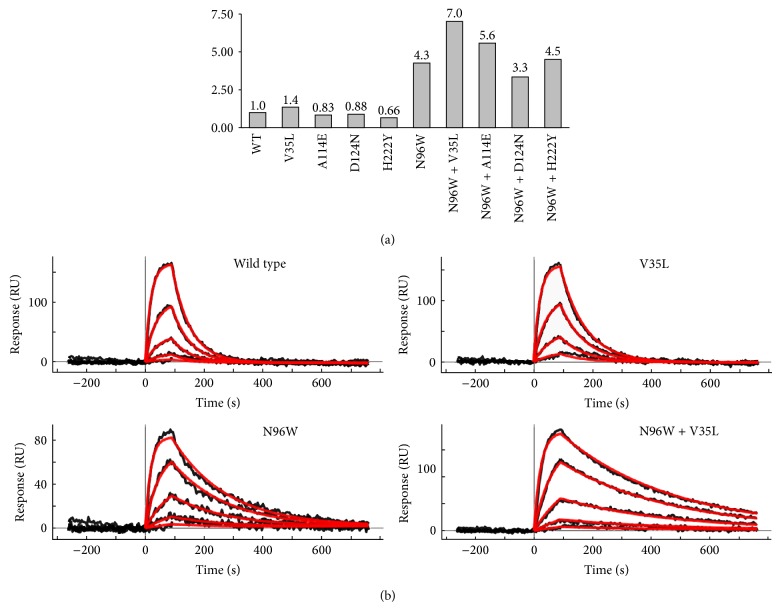
Figure 4.
Affinities of the IFNγR1 wild type (WT) and mutants to IFNγSC obtained from SPR measurements. (a) Graph represents relative affinities of IFNγR1 variants compared to WT. All selected “cavity” single amino acid mutation variants bind to the IFNγSC with similar affinity as WT, but the V35L variant has slightly higher affinity itself and further increases the affinity of the “interface” mutant N96W if combined together. (b) SPR sensorgrams showing the interaction between IFNγSC and selected IFNγR1 variants. The V35L variant behaves similarly as WT displaying fast association and dissociation phases. Two variants (N96W and N96W + V35L) with higher affinities compared to WT bind IFNγSC with slower dissociation phase, thus increasing the affinity. Measured SPR signal is in black and calculated fitted curves are in red; concentrations of IFNγSC used for SPR measurements were as follows: 0.1, 0.3, 1.0, 3.0, and 9.0 nM.

