Figure 5.
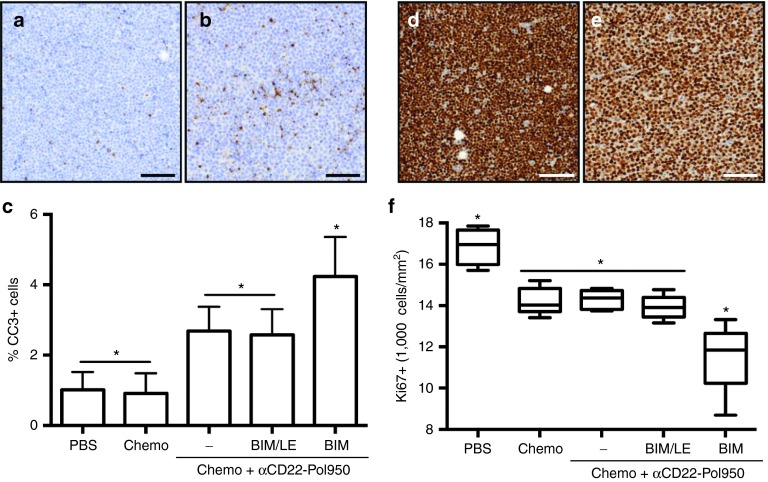
Apoptotic induction in tumors demonstrated by CC-3 and Ki-67 marker analysis. Lymphoma tumor-xenograft mice were treated with a single low-dose chemo (cyclophosphamide and bortezomib) in combination with αCD22-Pol950, αCD22-Pol950-BIM/LE, or αCD22-Pol950-BIM. Tumors (n = 5) were harvested after 48 and 72 hours, processed for immunohistochemistry, stained for CC-3 and Ki-67 markers and imaged on a TissueFAXS microscope (10×). Representative images of (a) PBS control and (b) αCD22-Pol950-BIM-treated tumors stained for CC-3 activity (brown) and nuclei (blue) (scale bar = 100 µm). (c) % CC-3+ cells in tumors quantified using HistoQuest software. Data represents mean ± SD. Representative images of (d) PBS control and (e) αCD22-Pol950-BIM treated tumors stained for Ki-67 activity (brown) and nuclei (blue). (f) Density of Ki-67+ cells/mm2 within entire tumors was measured. Boxes represent the first and third quartiles around the median and whiskers represent the minimum and maximum of each treatment group. For both staining protocols, entire bisected tumor sections were analyzed. Data analyzed with ordinary one-way ANOVA using Tukey's multiple comparison test for significance. CC, cleaved caspase; PBS, sodium phosphate buffer.

