
Figure 7.
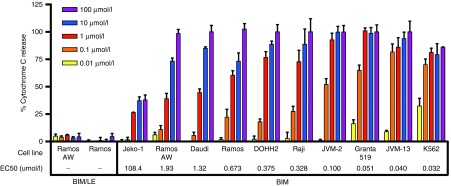
BIM activates cytochrome c release in a range of cancer cells lines with varying potency. Mitochondria isolated from 10 different cancer cell lines were incubated with BIM or BIM/LE for 30 minutes at a range of concentrations (0.01–100 µmol/l). BIM/LE (L62E) has a knockout mutation in the binding interface. The % cytochrome c release in the supernatant was quantified using an ELISA assay. The % cytochrome c release was defined as ((A450, sample)–(A450, DMSO))/((A450, Triton-X100)–(A450, DMSO)) × 100, where DMSO was used as a negative control and 1% Triton-X100 as a positive control. Data represents mean ± SD with n = 4. A nonlinear dose–response curve was fit to each data set using GraphPad Prism to determine the potency (EC50) of BIM in each cell line (italicized in the figure).