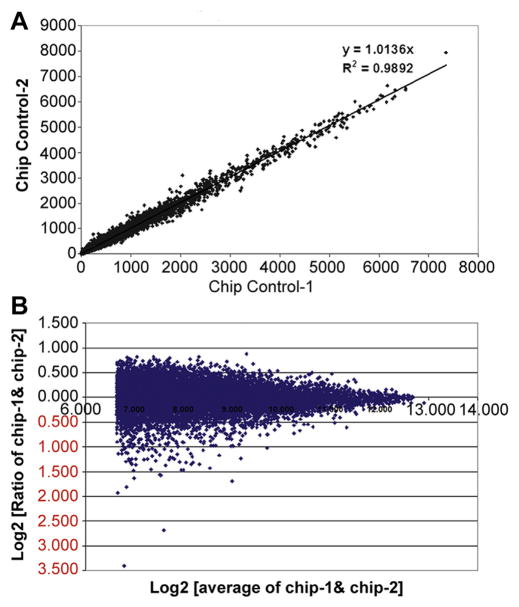
Figure 5.
Scatter plots used to define array reproducibility. (A) Gene expression intensities from microarrays using duplicate control cultures (self versus self-experiment). (B) Log scatter plot (control self-experiment). Signal values are graphed from all probe sets on the two arrays, each hybridized with one of two duplicate untreated sample targets.

