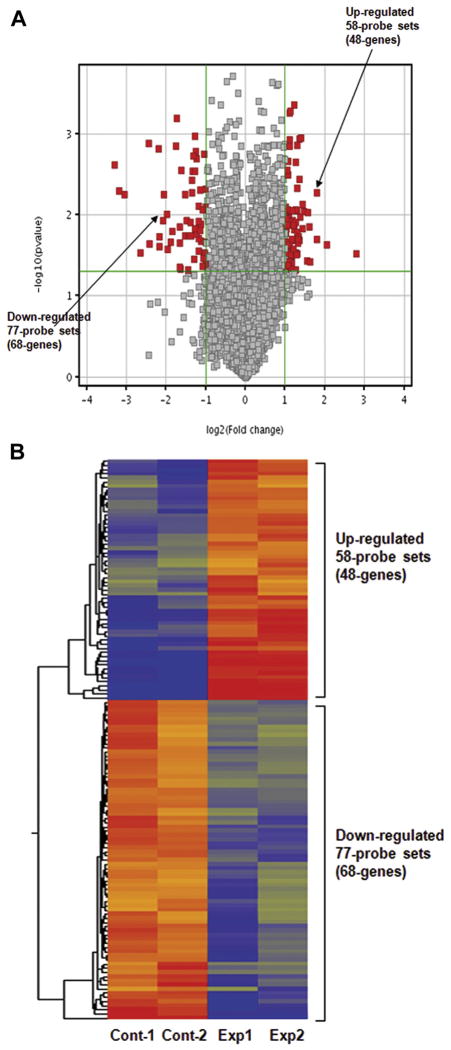
Figure 6.
(A) Volcano plot showing differentially expressed genes (135 differentially expressed probe set; 116 genes). Relationship between fold-change (>2; magnitude of change; x-axis) and statistical significance (P = 0. 05; y-axis) is shown. (B) Heat map from microarray data reflecting gene expression comparing four different samples: two controls and two coil-treated cultures.

