
Figure 3.
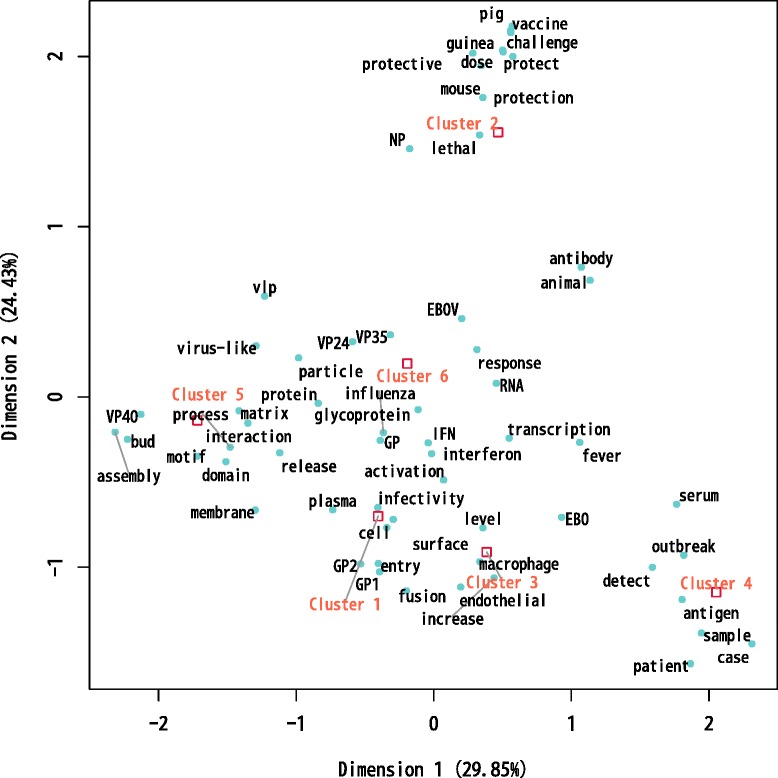
Plot of the correspondence analysis of the clusters. The euclidean distance among the clusters is a measure of the similarity of their word distribution. Also, the top 60 words filtered by their chi-square value were plotted. These words are representative of the closest clusters.