
Figure 4.
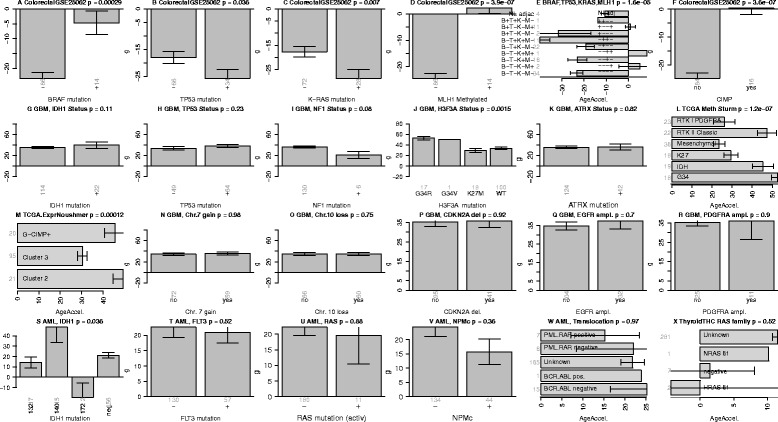
Age acceleration in colorectal cancer, GBM and AML. A-F) report results for colorectal cancer. Mean age acceleration (y-axis) in colorectal cancer versus mutation status (denoted by +) in A) BRAF, B) TP53, C) K-RAS. D) Promoter hyper methylation of the mismatch repair gene MLH1 (denoted +) is significantly associated with age acceleration. E) Mean age acceleration across different patient groups defined by combinations of BRAF, TP53, K-RAS, MLH1 status. The first bar reports the age acceleration in normal adjacent colorectal tissue from cancer patients but the sample size of 4 is rather low. F) CpG island methylator phenotype is associated with age acceleration. G-R) present results for various genomic abnormalities in glioblastoma multiforme. J) H3F3A mutations versus age acceleration. Samples with a G34R mutation have the highest age acceleration. Panels S-W (last row) show results for various genomic aberrations in acute myeloid leukemia. X) Thyroid cancer age acceleration versus RAS family mutation status is inconclusive since mutation status was largely unknown.