
Figure 1.
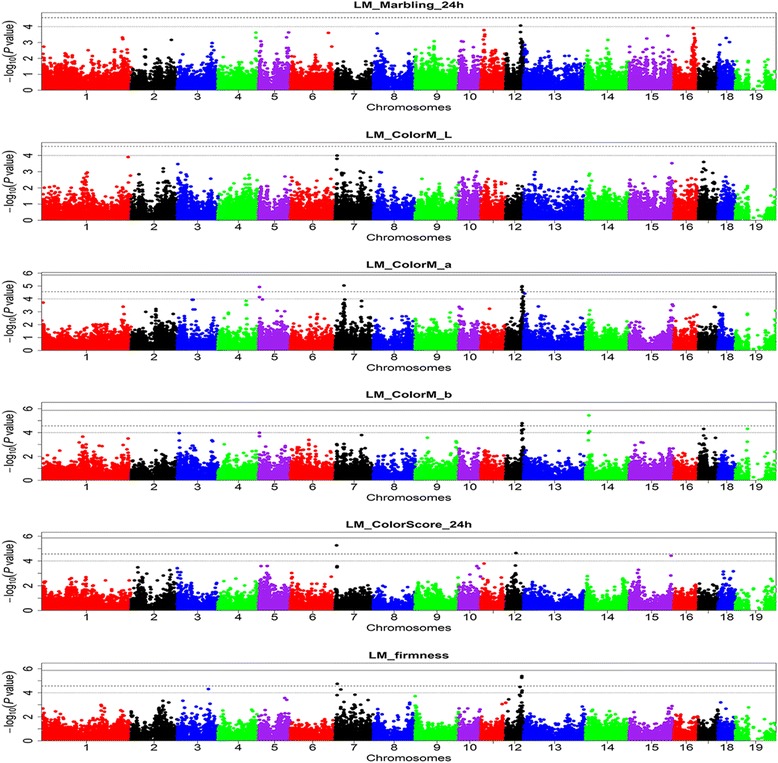
Manhattans plots of the GWAS for meat quality traits in the Erhualian population. In the Manhattan plots, negative log10 P values of the quantified SNPs were plotted against their genomic positions; SNPs on different chromosomes are indicated by different colours; dotted, dashed and solid lines correspond to the thresholds of 1.00E-04, 2.77E-05 and 1.38E-06, respectively.